The London Borough of Wandsworth is covered by 716 hectares of private domestic gardens – almost 20% of the borough’s total area. How might the provisions for wildlife contained within these gardens and the creatures making use of them add to the picture of biodiversity in Wandsworth? This was the question Brieannah Mollison-Read hoped to answer when she asked for GiGL’s helping in creating, hosting and managing the results of an online survey aimed at the residents of Wandsworth. The ‘On Your Street’ garden survey was a chance to truly find out what was going on in Wandsworth’s private gardens. Read on to find out how an excitingly large number of survey responses provided a rewarding data-wrangling challenge and resulted in the creation of the map with an impressive number of possible data combinations.
Project Background
Enable Leisure & Culture is a not-for-profit organisation, working in partnership with Wandsworth Council and other organisations to deliver a range of services, from managing local parks to staging public and private events, from running sports and community facilities. Enable are one of GiGL’s long running Service Level Agreement Partners and we collaborate on a regular basis.
Community Science Coordinator, Brieannah Mollison-Read, at Enable wanted to conduct a survey of the private domestic gardens across Wandsworth to better understand how they might contribute to the biodiversity of the borough. The organisation of a borough-wide survey was likely to result in a high volume of data to sort, analyse and visualise after the survey’s end. So, Brieannah got in touch with the data experts here at GiGL, to ask for our assistance with running the survey. Members of GiGL’s partnership team are always happy to help our SLA partners with longer-term projects such as this. an online survey using Cognito Forms was created which would effectively collect garden data across the whole borough. The survey is hosted by GiGL, with a communications campaign run by Enable to promote the project to residents.
The survey – aims, design and responses
The Enable team liaised with the GiGL to confirm the contents and format of the survey. In short, the purpose of the survey is to find out more about borough residents’ gardens and what species of animals they often spot – or do not spot. It will also allow for more targeted engagement with specific streets to improve the joining up of habitats and/or features for nature. In turn, this information will feed into the Wandsworth Council’s Biodiversity Strategy, focused on improving and connecting existing habitats for wildlife across the borough.
The survey questions are designed to support these aims. They ask about the presence of a selection of wildlife, and features for wildlife, in the respondents’ gardens that were indicative of their overall biodiversity. The survey includes questions from a range of different categories, such as:
- Features for wildlife – which provisions for wildlife are present in gardens, under the sub-categories of connectivity, food, shelter and water.
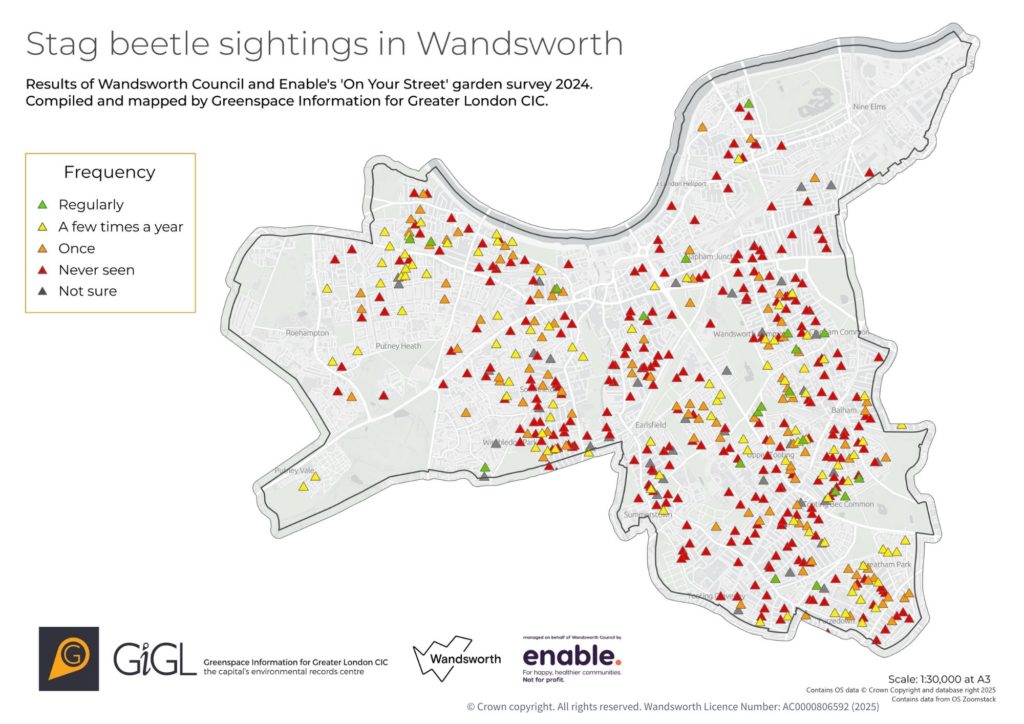
- Species sightings – how often borough residents spot seven selected species within their gardens or streets. These are seven of the priority species within the borough’s biodiversity strategy.
- Hard surfacing – how much of the respondent’s front and back gardens consist of hard surfacing?
- Recording wildlife – are residents recording the wildlife they saw in their gardens, or do they want to in the future?
Such categories were chosen to allow for analysis of overlaps in reported garden features and sightings. For example, did those who provided appropriate nesting habitats for stag beetles report more sightings of this distinct species? Was an abundance of nectar-rich flowers linked to higher numbers of pollinators visiting gardens? These were the types of questions it was hoped could be answered, along with gaining a more comprehensive overview of the value of the gardens to wildlife.
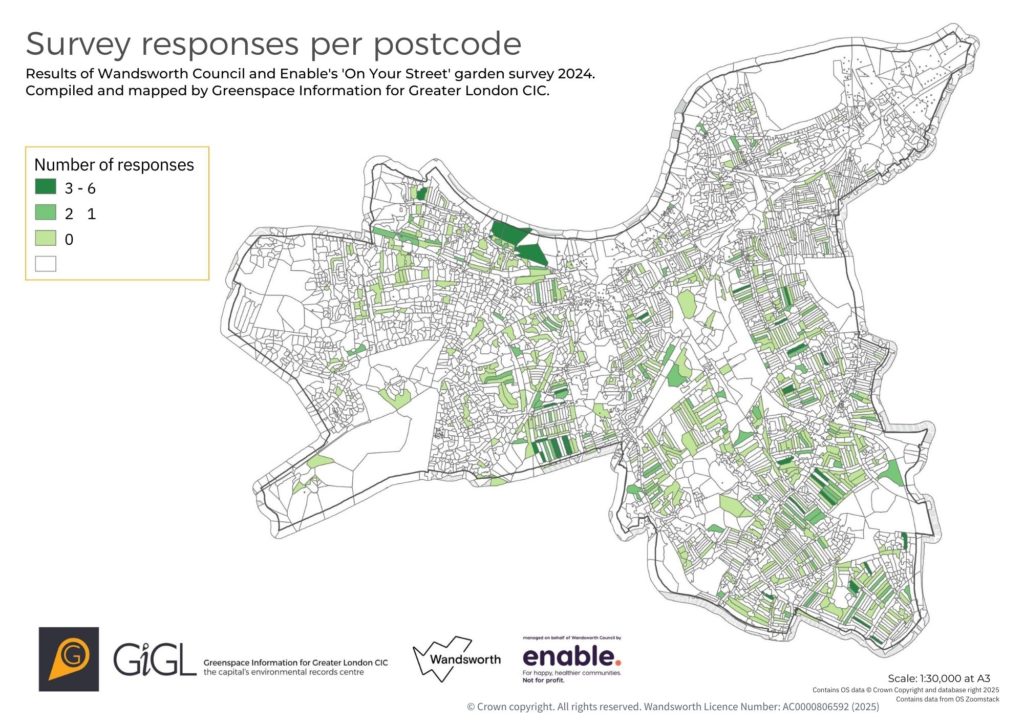
Thanks to a strong communications campaign by Enable, the ‘On Your Street’ garden survey was hugely successful in gathering responses from borough residents. During the survey period spanning June to October 2024, an impressive 782 responses were submitted. Millie Coe, Communications and Outreach Lead Officer at Enable, comments on the success of the communications campaign for the project:
“By leveraging our social media channels and working with local community and Friends Of groups, we generated strong engagement with the On Your Street survey. This collaborative approach helped raise awareness and encourage widespread participation across the borough.”
The map below shows the borough shaded in relation to the number of submissions each postcode received.
Initial outputs – static maps, graphs and word cloud
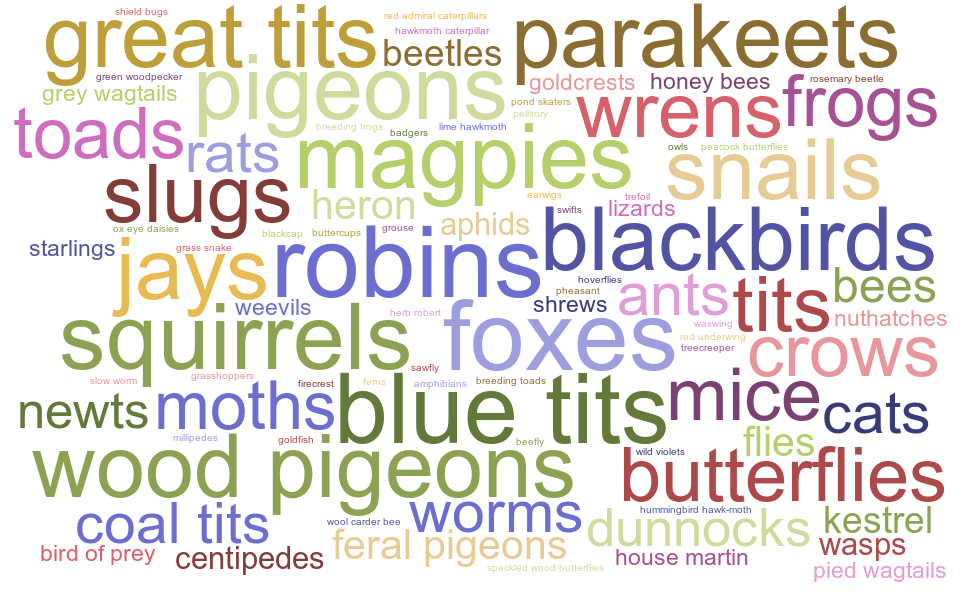
After the survey’s conclusion, members of the GiGL and Wandsworth teams met to decide which outputs would be most helpful in conveying the results to the public. Following this, the partnership team at GiGL created a set of static maps that displayed the responses to each survey question. We created a set of graphs to summarise the information from selected responses and also produced a word cloud to display the other species residents noted seeing in their garden besides the seven which had been specifically asked about.
Whilst useful for providing an initial overview of the survey results, the static maps did not provide any opportunity for custom exploration of the data. What if the end user wished to only view the locations where bats were regularly sighted, or see which areas of the borough had no hard surfacing in their back gardens? It was clear that there was the need for a more comprehensive way of configuring the data. So, the interactive map was created.
The interactive map
This interactive map lets you explore the results from the garden survey in a visual way. You can view responses to different questions and see how they connect across Wandsworth.
Each survey question appears as a separate layer on the map. You can turn layers on or off, and use preset map views to help you get started. There are also filters to help you find specific responses. The map includes helpful tools like an address search bar and different background styles (basemaps) to make navigation easier.
Because the map has many features, it works best on a laptop or desktop screen.
How the data is shown
We used two main ways to display the survey data:
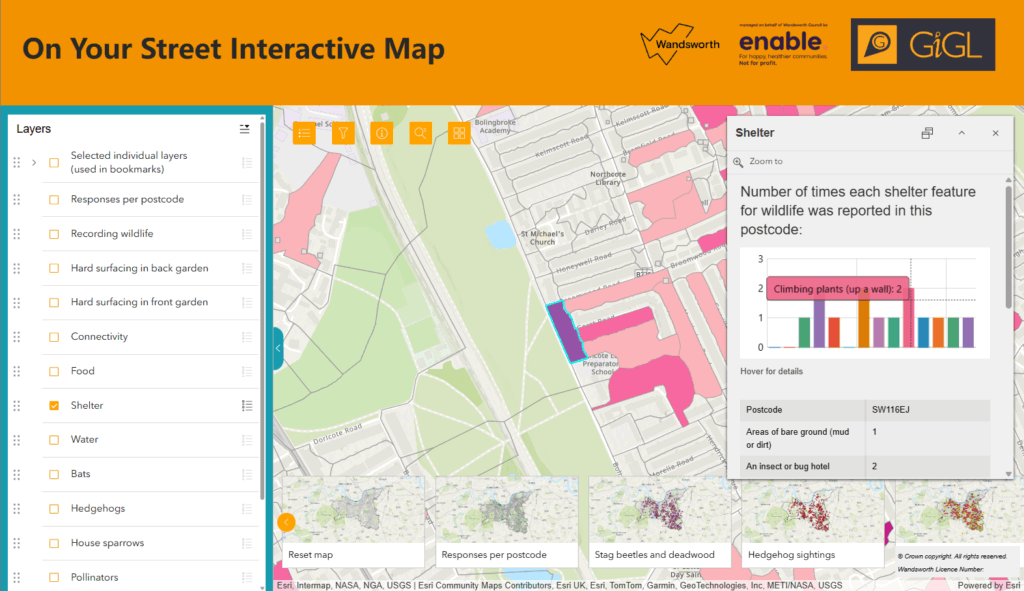
1. Wildlife Features
The ‘features for wildlife’ questions are grouped together to show how many reports of a particular feature there are per postcode. When a postcode is selected on the map, a popup appears which first displays a graph and then a table of the number of features reported within that postcode. For example, in the image below, 14 features for wildlife within the shelter category were reported at the highlighted postcode:
2. Other Responses
The responses for all other question types – species sightings, recording wildlife and hard surfacing – are displayed as one point per survey response, with responses for the same postcode layered on top of each other. This allows layers to be filtered for more tailored analysis. Users can click on a point and toggle through all the answers for that location using a set of arrows in the popup.
Tip: Try turning on species layers along with wildlife feature layers to spot interesting patterns.
With the combination of formats used to display the data and the functions available within the interactive map, it is hoped that exploring the results of the garden survey will be a straightforward experience for everyone – from borough residents to local wildlife experts.
Instructions are available on the map itself, and there’s also a short video guide made by Brieannah and Millie from Enable to help you use it here.
We hope that the interactive map will allow users to discover their own connections in the garden data and let Wandsworth residents know a little bit more about the value to wildlife that exists in their postcode, the surrounding area and the wider borough.
Next steps
Following the success of the first round, the garden survey has been re-opened for a second time! If you are a resident of the borough of Wandsworth, you can access the survey here to add your response and tell us what can be found in your garden. The survey is live right now and will be open for a month, until midnight on Sunday the 15th of June 2025. Please note, responses from outside the borough of Wandsworth will not be included on the map. If you already submitted a response during the first survey round, you do not have to submit another. We are excited to see how these extra responses can add to the picture of biodiversity across Wandsworth.