This document has been designed with accessibility in mind. If you require it in a different format, please contact Greenspace Information for Greater London CIC.
London’s Local Nature Recovery Strategy
Local Habitat Map
Instructions on how to use the online map on a computer screen
Contents
Definitions
This section explains key terms to help users better understand the instructions and the map.
Introduction
These instructions are designed to help users navigate and understand the features of London’s Local Nature Recovery Strategy Local Habitat Map.
Map
The main map is located at the centre. Additional information in the form of pop-up boxes can be seen by clicking on the coloured areas of the ‘Potential measure locations’ and ‘Landscape Areas’.
Left Panel
This is located on the left of the main map. Along with the initial screen this provides useful information about the map.
Drop-downs
The drop-downs offer options for different views of the map and additional information.
Zoom
This refers to the grey buttons showing a plus sign, a minus sign and an image of a house, located at the bottom right of the map. These provide different options for zooming in and out of the map.
Frequently Asked Questions
This section shows answers to common user questions about where to find specific information on the map and how to use its features.
Definitions
- Geographic Information System (GIS): The Local Habitat Map is made using GIS software. GIS is a mapping software that combines maps and data to help analyse the data to see patterns and present the information visually. It is a digital toolbox for working with location-based information. It consists of integrated computer hardware and software that store, manage, analyse, edit, output, and visualise geographic data.
- Polygon: In GIS, a polygon is a shape that defines a geographic area. It can be considered as a boundary or outline that encloses an area, like a country, a building, or a park.
- Layer: In GIS, a layer is a fundamental building block of a map, representing a specific type of geographic data, such as roads, land use, or population density. It can be considered as a slice or stratum of geographic information, organised and displayed on a map. The are usually many polygons in each layer. Layers can be combined to create complex, informative maps.
- Metadata: In GIS, metadata is information about geographic data. This includes the data’s characteristics, creation details, and quality. It essentially acts as a document describing the data. This helps their discovery , management, and use.
- Licencing: Data licensing is a legal arrangement that specifies the terms under which a dataset can be used. It grants permission to use, share, modify, or distribute data, while also protecting the rights of the data owner. Essentially, it’s a contract outlining how data can be accessed and reused. This ensures both the user and the data creator understand their obligations.
Introduction
London’s Local Nature Recovery Strategy (LNRS) Local Habitat Map (‘the map’) was created by Greenspace Information for Greater London CIC (GiGL), on behalf of the Greater London Authority (GLA). GiGL is the capital’s local environmental records centre. These instructions have been prepared to help users of the online map navigate and understand the different features of the map.
Additionally, you can access the video instructions for the map.

Figure 1: The initial welcome screen of London’s Local Nature Recovery Strategy (LNRS) Local Habitat Map.

Figure 2: London’s LNRS Local Habitat Map. The online map’s features provide further information and options to explore the map. (Contains OS data © Crown Copyright and database right 2025. Ordnance Survey 100032216. Contains data from OS Zoomstack)
Elements of the Local Habitat Map
- Initial screen: This is the initial welcome screen of the online map. It provides useful information about the different layers of the map and further links. You need to read the information and confirm you understand it by clicking the tick box and then ‘OK’.
- Map: The main map is located at the centre. Additional information in the form of pop-up boxes can be seen by clicking on the coloured areas of the different layers.
- Left panel: This is located on the left of the main map. Along with the initial screen this provides useful information about the map.
- Drop-downs: These are located in the top right corner and provide different features to explore the map.
- Zoom: This refers to the grey buttons showing a plus sign, a minus sign and an image of a house, located at the bottom right of the map. These provide different options for zooming in and out of the map.
Map
By clicking on the coloured areas on the map, which is located at the centre, you can get additional information from pop-up boxes. Zoom in and out of the map using the zoom icons in the bottom right corner of the map, or your scroll on your mouse, see Zoom section for more information.
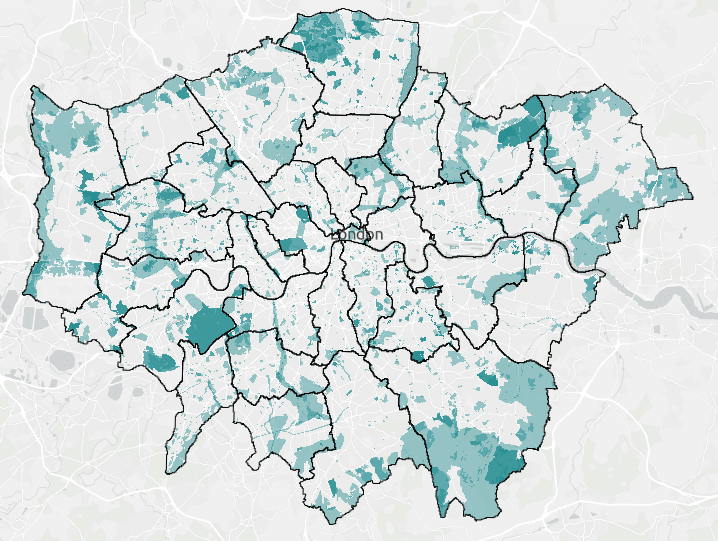
Figure 3: The main area of the online map showing the potential measures locations layer. (Contains OS data © Crown Copyright and database right 2026. Ordnance Survey 100032216. GLA. Contains data from OS Zoomstack.)
Pop-up Boxes
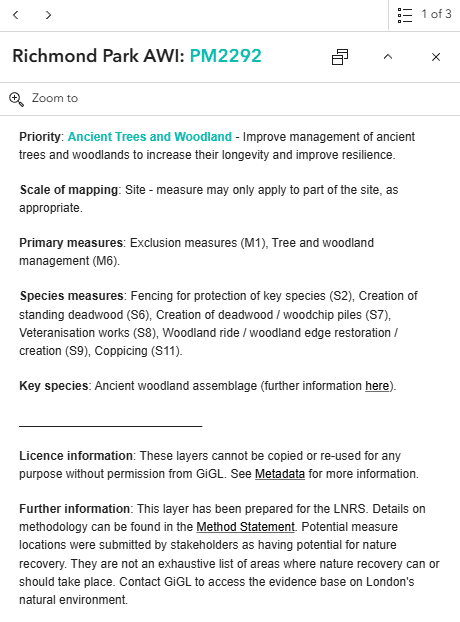
Figure 4: Example of a pop-up box for a potential measure location.
- Sometimes there is more than one relevant potential measure in an area and polygons overlap. Arrows at the top left of the pop-up box let you see information for the different priorities suggested for this location.
- You can zoom in to the specific location by clicking on the looking glass (‘zoom to’ option).
- You can see a list of overlapping polygons by clicking on the list symbol (three small squares with a horizontal line to the right of each) at the top right corner.
- You can scroll down to see all the information in the box.
- Click X to close the box.
- Click on the circumflex (^) symbol to collapse the box so that just the title shows.
- The symbol of two boxes next to the title changes whether the pop-up box stays at the side of the map or near the site it relates to.
The information displayed is for the highlighted location. This highlighted location is shown in a brighter colour with a pale blue line around it.
Left Panel
This is the box on the left-hand side of the map with writing in. The left panel includes links to important documents, such as the statement of biodiversity priorities, instructions on how to use the map, the LNRS focus species and method statement. Licencing information is also provided. You can use the arrow on the right-hand side
of the panel to close and open it.

Figure 5: The left panel with additional information about the map.
Drop-downs
The drop-downs at the top right corner offer options for different views of the map and additional information.
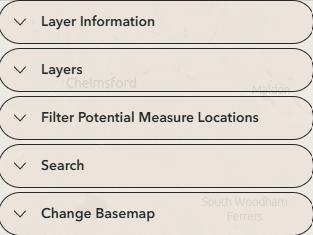
Figure 6: The different dropdowns at the top right corner of the map.
- Layer Information: This includes a description of each of the map’s layers.
- Layers: This is the legend for the map where you can turn on and off different layers and find out what symbology they have on the map. (see Map layers section for more information).
- Filter Potential Measure Locations: offers the option of filtering the potential measure locations to see different LNRS priorities or scales of mapping (see Filter section for more information).
- Search: Here you can search for a place name, address or specific Potential Measure using the PM ID (e.g. PM1234)
- Change Basemap: changes how the background map looks.
Map layers
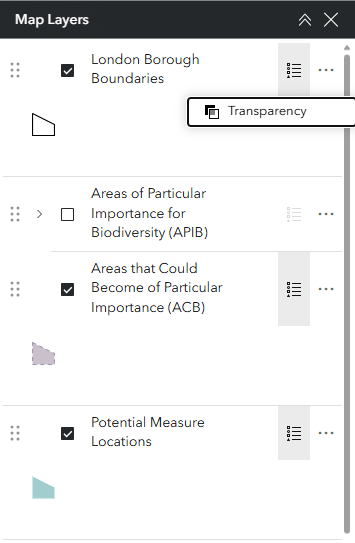
Figure 7: The features of the map layer button.
- Click on the tick boxes to see different layers. If you tick the box that layer will be ‘on’ (visible). If the box is unticked the layer will be ‘off’ (not visible).
- Click on the six dots on the left of each layer and drag to change which layer is shown on top. The layer on top will be most visible if it overlaps with other layers.
- Click on the three dots on the right of each layer to make the layer more or less see-through.
- Click on the list symbol (three small squares with a horizontal line to the right of each) to see what this layer looks like.
- Click on the circumflex symbol (^) to collapse the box so that just the title shows.
Filters
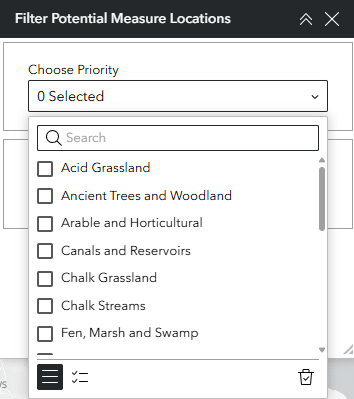
Figure 8: The different features and options of the Filter button.
- There are two options for filtering the potential measure locations. The first option is to filter by LNRS priority. The second option is to filter by the scale of mapping (sub-site, site or multi-site). You can use the filters separately or combine them.
- From the drop-down menu select the different LNRS priorities or scale of mapping that you want to filter by. For the LNRS priorities you can select multiple options if needed. The selection will show on the map automatically after a few seconds.
- The bin at the bottom right of the window allows you to clear your selection and return to the default view.
Zoom
The plus, minus and house buttons at the bottom right corner provide options for zooming in and out.
Zoom options
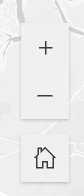
Figure 9: Zoom options at the bottom right of the map.
- Use the plus symbol to zoom in.
- Use the minus symbol to zoom out.
- Use the home symbol to return to the default London-wide zoom level.
Other zoom options:
- With a mouse use the wheel.
- On a touch pad or phone/tablet screen use two fingers.
- From the search button at the top right, type a place of interest and click on it from the drop-down menu.
- From a pop-up box you can zoom in to a specific polygon.
Frequently Asked Questions
Follow the links provided below for further instructions.
Where can I find…?
- More information on the potential measures?
- Answer: Click the ‘Statement of Biodiversity Priorities’ link provided in the left panel.
- More information on the priorities?
- Answer: Click the ‘Statement of Biodiversity Priorities’ link provided in the left panel.
- Information about licencing and/or metadata?
- Answer: Click on the metadata document” link in the left panel.
- More information about priority species?
- Answer: Click the ‘Priority species’ link provided in the left panel.
- More information about how the layers where created?
- Answer: Click the ‘Method Statement’ link provided in the left panel.
How can I…?
- Turn different layers on and off (so they are visible or not visible)?
- Answer: Use the Layers drop-down button at the top right.
- Change the transparency of each layer?
- Answer: Use the Layers drop-down button at the top right.
- Filter the potential measures to see the priorities I want to focus on?
- Answer: Use the Filter drop-down button at the top right.
- Change the layer that is on top/ shown first?
- Answer: Use the Layers drop-down button at the top right.