Julie Cox, GiGL Data Officer
Records centres like GiGL can do more with biological records than you may imagine. Collation and provision of data and data products is, of course, very important. However, analysis of existing records can also inform future recording efforts. Analysis of London’s data shows interesting spatial and temporal patterns, and these can help our recording community to both put their records in context and locate areas in need of surveying.
Recently, GiGL and our partners have been asking specific questions of our species dataset to find out: where species have been recorded, where we have only historic species records and whether we can identify areas that are under-recorded for a group of species.
Where has a species been recorded?
Over the winter we were approached by a recorder who wanted to know more about our records of true flies (Diptera). He was interested not only in the spatial coverage of records, but also in comparing areas for which he has collected records with areas covered by other recorders.
We selected all Diptera records with an accuracy of 1km or greater and then intersected them with a 1km grid covering Greater London. We then highlighted grid squares containing records on a distribution map. The result showed an uneven spread of records across the city; probably a reflection of recording effort rather than species distribution. This demonstrates an important principle within GiGL’s species records; just because we don’t have a record for something it doesn’t mean the species isn’t there, we just haven’t been told whether it is there or not. It is why negative records, where a species is searched for and not found, are sometimes just as important as positive records.
Armed with the map and a list of the recorded 1km squares, our Diptera recorder is now able to start directing his efforts to fill the gaps.
Are there areas where we have only historic records for a species?
It’s very interesting to highlight areas of London where species have been recorded in the past, but have not been recorded in recent years. But, where do these discrepancies indicate the loss of species from an area, and where are they purely indicative of a change in recording effort? Just like most human interests, fashions in recording have changed over time. At different times, some species have been surveyed for more or less than others. Species datasets can also reveal the interests of local resident recorders. When individuals move house or stop recording that can be seen within our datasets too. The first step in investigating these historical discrepancies is to produce an indicative map.
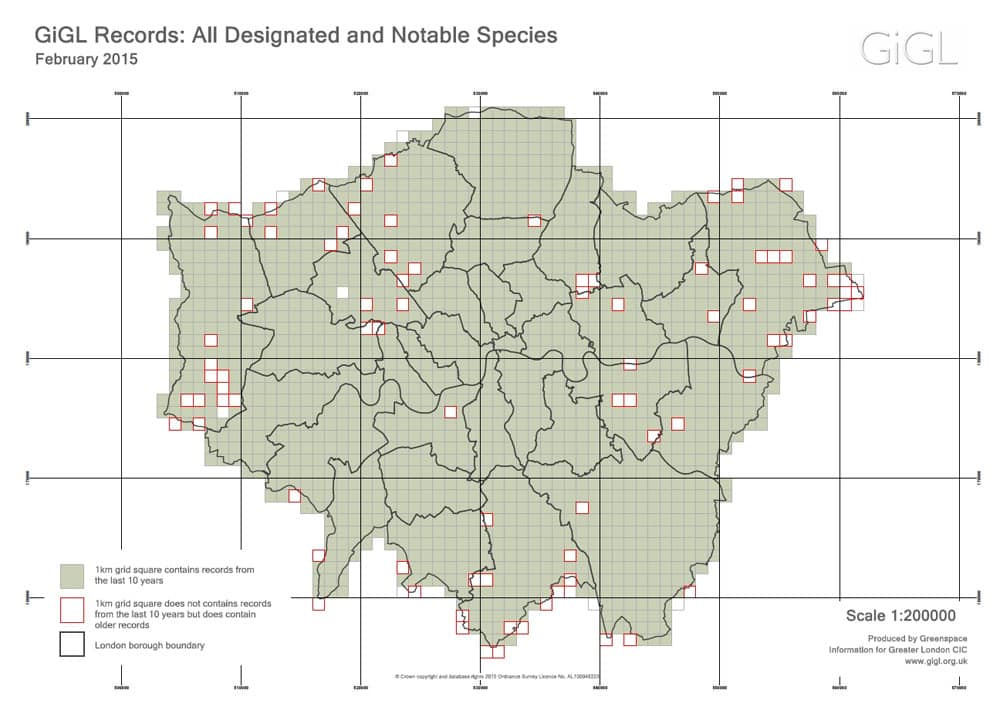
Natural England are also interested in historical patterns of recording, and as part of their annual agreement with Local Environmental Records Centres they asked us to list 1km grid squares which had historic records for legally protected species, but no records from within the last ten years. We found the results fascinating, particularly once the results were mapped. In London we flag species with additional conservation designations as well as those with formal protection through the planning process, so we mapped these too.
Both maps demonstrate the importance of almost all parts of Greater London for designated and notable species, but also the terrific work of London’s recording community, with species having been recorded almost everywhere.
There are, however, 1km grid squares where no designated or notable species have been recorded, or where they have been found historically but not within the last ten years. Are these species not found there, or is it that no-one has submitted any records? Another challenge for our recording community perhaps?
We’ve created a new webpage to communicate our findings. The page also displays maps we’ve made for other species and species groups. We hope the maps will be useful in showing the recording gaps which exist for different species, and inspire recorders to survey in those gaps and submit their sightings to GiGL.
Can we highlight areas that are under-recorded for a group of species?
GiGL is an integral partner in the Making a B-Line for London project. Building upon our previous data analysis the project was interested to know more about the available data on flower-visitor species. These included Hymenoptera records (bees and wasps, but excluding ants), Lepidoptera records (butterflies and moths) and Syrphidae records (flies from the hoverfly family). Are these taxonomic groups well recorded throughout London?
To investigate this we’ve worked with Laura Graham, a PhD student from Sheffield University, who has developed a code which uses a statistical technique called species accumulation curve analysis to provide a measure of the confidence that all species have been found within a particular area. GiGL used Laura’s code and the flower-visitor species data to calculate how confident we can be that all flower-visitor species have been recorded in each 1km grid square within Greater London. The result is a percentage score for each grid square where, for example, a value of 0.95 represents 95% confidence that all species have been found within that grid square.
So, next time you’re planning a trip out to the field, why not get in touch, request some maps and see if you can help investigate one of London’s data gaps? Perhaps it shouldn’t be a void at all.
Julie Cox has worked at GiGL as a Data Officer for the last five years. She has enjoyed participating in GiGL’s growth over that time, both in terms of the strength of the GiGL partnership but also its technical ability. She’s very proud that GiGL is increasingly undergoing more, and more complex, data analysis in order to assist London’s recording community.