Ian Yarham, ex-London Ecology Unit & GLA
Areas of Deficiency as a tool to promote access to nature
Maps of Areas of Deficiency for nature (AOD) appeared in all the borough handbooks produced by the London Ecology Unit during its lifetime, from 1986 to 2000. The aim was to show where people had to walk more than one kilometre to reach an accessible wildlife Site of Metropolitan or Borough Importance. The maps were drawn by putting a compass on the different parts of the boundary of the sites and then drawing circles outwards from these. Anywhere beyond the interlocking circles was defined as being in an “Area of Deficiency” for access to nature.
There were a number of problems with this approach. Firstly, it assumed that all sites were accessible at all points on their boundaries which was plainly not so. For example, some cemeteries, including Streatham and West Norwood Cemeteries, have only one entrance. People living in houses adjoining the far boundary wall will have a journey of more than one kilometre to get to the entrance. A second problem was that very rarely was it possible to walk in a straight line of one kilometre from a site. Barriers such as railways and rivers would force the walker away from the straight line, as would the haphazard road pattern of much of London. A third issue was that the nature conservation value of some sites was found in just a part of their area while the one kilometre was not measured from where those wilder areas were found, but from the boundary of the whole site.
There were a number of other issues but perhaps the greatest anomaly was that all freely accessible Sites of Metropolitan and Borough Importance tended to be given the same weight when measuring access to nature. For example, it was taken that somebody living one kilometre from Hampstead Heath or Epping Forest had exactly the same access as somebody living one kilometre from Harleyford Road Nature Garden in Vauxhall. Pleasant as Harleyford Road is, it is stretching the imagination to imagine someone living 900 metres away as being as likely to walk to the nature garden as would someone living 900 metres from Hampstead Heath walking to the Heath. Despite this, a one kilometre circle was drawn around Harleyford Road Nature Garden which meant that most of the northern part of Lambeth was not defined as being in an AOD. This was clearly not the case.
When the very last London Ecology Unit handbook was produced – Nature Conservation in Brent, we took the opportunity to come up with a more accurate measure for AOD. The Brent handbook was finalised and published in the first few months of the Greater London Authority when we were able to start using GIS, albeit at this stage, via the boroughs’ system. As time went by and the GLA acquired its own GIS system, the biodiversity team were able to refine and define the best way to map Areas of Deficiency in access to nature.
Firstly and most importantly, it was necessary to accurately measure walking distances from the point where people reached the nature conservation site. To do this, all accessible metropolitan and borough grade sites were assessed, and many visited, to check where access points were situated and whether they really gave access to ‘hands on’ nature. The River Thames in central London was excluded as people could only look at it. However, the Thames in Richmond or Bexley where the banks were more natural and people could walk down to the river was included. The exercise also took on board the fact that, because of the paucity of sites in some of the inner boroughs, a site classed as being of borough importance in Islington, for example, would only be classed as of local importance at best in Bromley or Barnet. This was the Harleyford Road situation again. The result was that only freely accessible sites of a certain quality were used. Sites where you had to pay or where the reasons for classification were specialised (for example rare lizards or lichens, or where a good grassland was always cut short and only a botanist would recognise the flora) were excluded. Then, using GIS and some visits to an area to check walking routes, the one kilometre distance was measured using a piece of string on the map. Occasionally, computer programmes which were supposed to do this were tried but, at the time, these could never allow for a shortest route where open space or footpaths were involved. Some footpaths, once seen in reality, we discovered were so unpleasant or downright dangerous that they were not recommended. Some sites were full of rubbish or next to a busy road – in these cases it was decided that the enjoyment of nature was rather dubious and these places were excluded. Before the days of Street View, only by visiting a site could we assess this.
After Brent, boroughs were methodically assessed across Greater London, finishing around Heathrow Airport in Hillingdon. The whole process took four years. With the benefit of GIS, areas could then be measured and a league table drawn up of the percentage of each borough area (excluding Green Belt and MOL) as an AOD.
The results were surprising. The City of London with a figure of 100% deficient was as expected, Enfield at 39% and Havering at 37% were not. Closer inspection of the maps gave an explanation. In Enfield, much of the Lea Valley consisted of inaccessible reservoirs, while to the west of these was a swathe of industry and housing through Tottenham, Edmonton and Ponders End with few wildlife sites. In Havering, almost all the good sites were around the edge of the borough, either in the Green Belt to the east and north or the Beam Valley to the west, and in the centre around Romford there was a large area without good wildlife sites. The next borough, Tower Hamlets at 36%, was more as expected.
At the other end of the scale were Kensington and Chelsea at 9% thanks to sites like Kensington Gardens, Holland Park, and Brompton and Kensal Green Cemeteries; and Wandsworth at 11% with Richmond Park, Barnes Common, Battersea Park, Putney Heath and Tooting Bec Common.
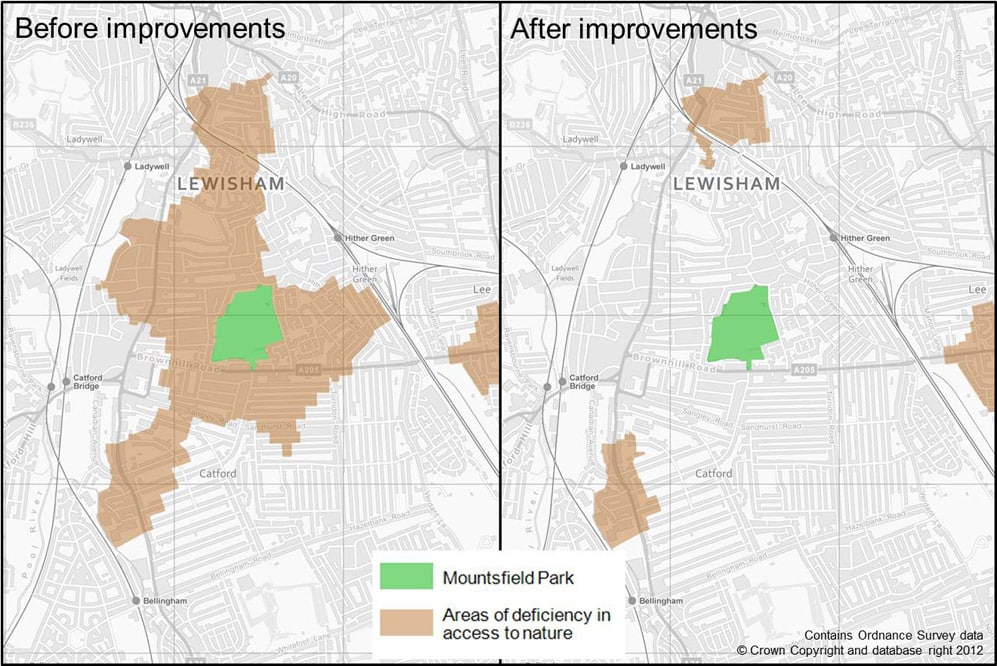
There are a number of ways an AOD can be reduced; the value of an existing local site can be increased so it becomes a borough site, by gaining access to a previously inaccessible site, by opening up new access points, or by shortening a walking route. An example of the first was where Lewisham Council decided to manage Mountsfield Park in Catford for nature conservation and this became a Site of Borough Importance. As a result, a large AOD was substantially reduced. Shortening walking routes is much harder to achieve and can be far more expensive. Sometimes it can be achieved as a bonus to a development scheme. For example, when the new Emirates Stadium was constructed for Arsenal, a bridge over the railway lines south of Finsbury Park was built so that fans could easily access the ground from Arsenal Station. This also meant that reaching London Wildlife Trust’s Gillespie Park involved a much shorter walk for people living in houses on the west side of the railway lines.
As expected, there were still anomalies and queries, and some boroughs wanted advice on how they could reduce their AODs. Developers also felt that a housing scheme in an ‘Area of Deficiency’ would reduce the value of their properties. Developers at North Greenwich asked for the designation to be reviewed and removed – to no avail. One clear anomaly was that inevitably some of the poorest areas of London (for example Hackney near the Lea Valley) were not in an AOD, whereas some of the wealthiest parts were. A good example of the latter was the Woodcote Park Estate near Purley where the average garden seemed to be about an acre, and if accessible and located in Islington would be a wildlife site. We commented at the time that we would be more than happy to live in this ‘Area of Deficiency’.