Emma Knowles, GiGL Partnership Officer
CPRE London have recently published a report on London’s Green Belt and Metropolitan Open Land (MOL), for which GiGL provided our expertise, including data analysis, visualisations and maps. The report aims to raise awareness of MOL and provide information on its distribution, along with that of Green Belt, to politicians and the general public. As the curator of an independent, London-wide database of designated sites, we were well placed to assist them.
What are Green Belt and Metropolitan Open Land?
Green Belt is a well-known designation applied to undeveloped land around cities to prevent the spread of urbanisation, encourage re-use of previously developed sites and maintain the distinct nature of towns and cities. MOL receives less publicity than Green Belt, but has equal legal status; it is a designation that protects open land within the city, as opposed to around the edge. MOL is specific to London, and can be applied to open space that contributes to the structure of the city, provides open air facilities for sport and recreation, contains features of historic or biodiversity value, and/or forms part of the green infrastructure network.
The project
Keeping the GiGL database as accurate as possible is a key aspect of our day-to-day work, and an ongoing challenge. New data are continuously generated by many sources: Green Belt and MOL is designated by the 32 London Boroughs plus the London Legacy Development Corporation, which manages the Queen Elizabeth Olympic Park (the City of London has no Green Belt or MOL within its boundary). As a first step in creating an overview of these designated sites, CPRE London assisted us with our annual call for new data, in order to ensure our existing datasets were complete and up-to-date.
Designated sites data can require updating for three main reasons: changes to site designations as new policy documents are published by Local Authorities; increased accuracy of mapping by data providers; and provision of new data not previously held by GiGL. We initially held Green Belt data for all boroughs, but nine had never supplied us with MOL data. Analysis of borough policy documents showed that, for both designations, there were changes to the designated sites in some areas that were not yet reflected in our database. An example of this was changes as a result of the development of the Olympic Park.
With support from CPRE London, we asked all boroughs to provide the GIS data needed to update our datasets, or to verify the data we already held. All boroughs responded, so we were able to build a comprehensive and contemporary snapshot of all Green Belt and MOL in Greater London.
Statistical insights
Using the resulting comprehensive datasets, GiGL provided CPRE London with a series of data analyses, including maps, visualisations and interpreted data tables, to inform their report. This included analysing the Green Belt and MOL data against land use and Sites of Importance for Nature Conservation (SINCs) data managed by GiGL and statutory designated sites and Ancient Woodland datasets published by Natural England. Our analyses led to some interesting findings.
Key Findings
- 22% of Greater London (35,109 hectares) is designated as Green Belt
- Almost 10% of Greater London (15,681 hectares) is designated as Metropolitan Open Land (MOL)
- The designations are not spread evenly across Greater London
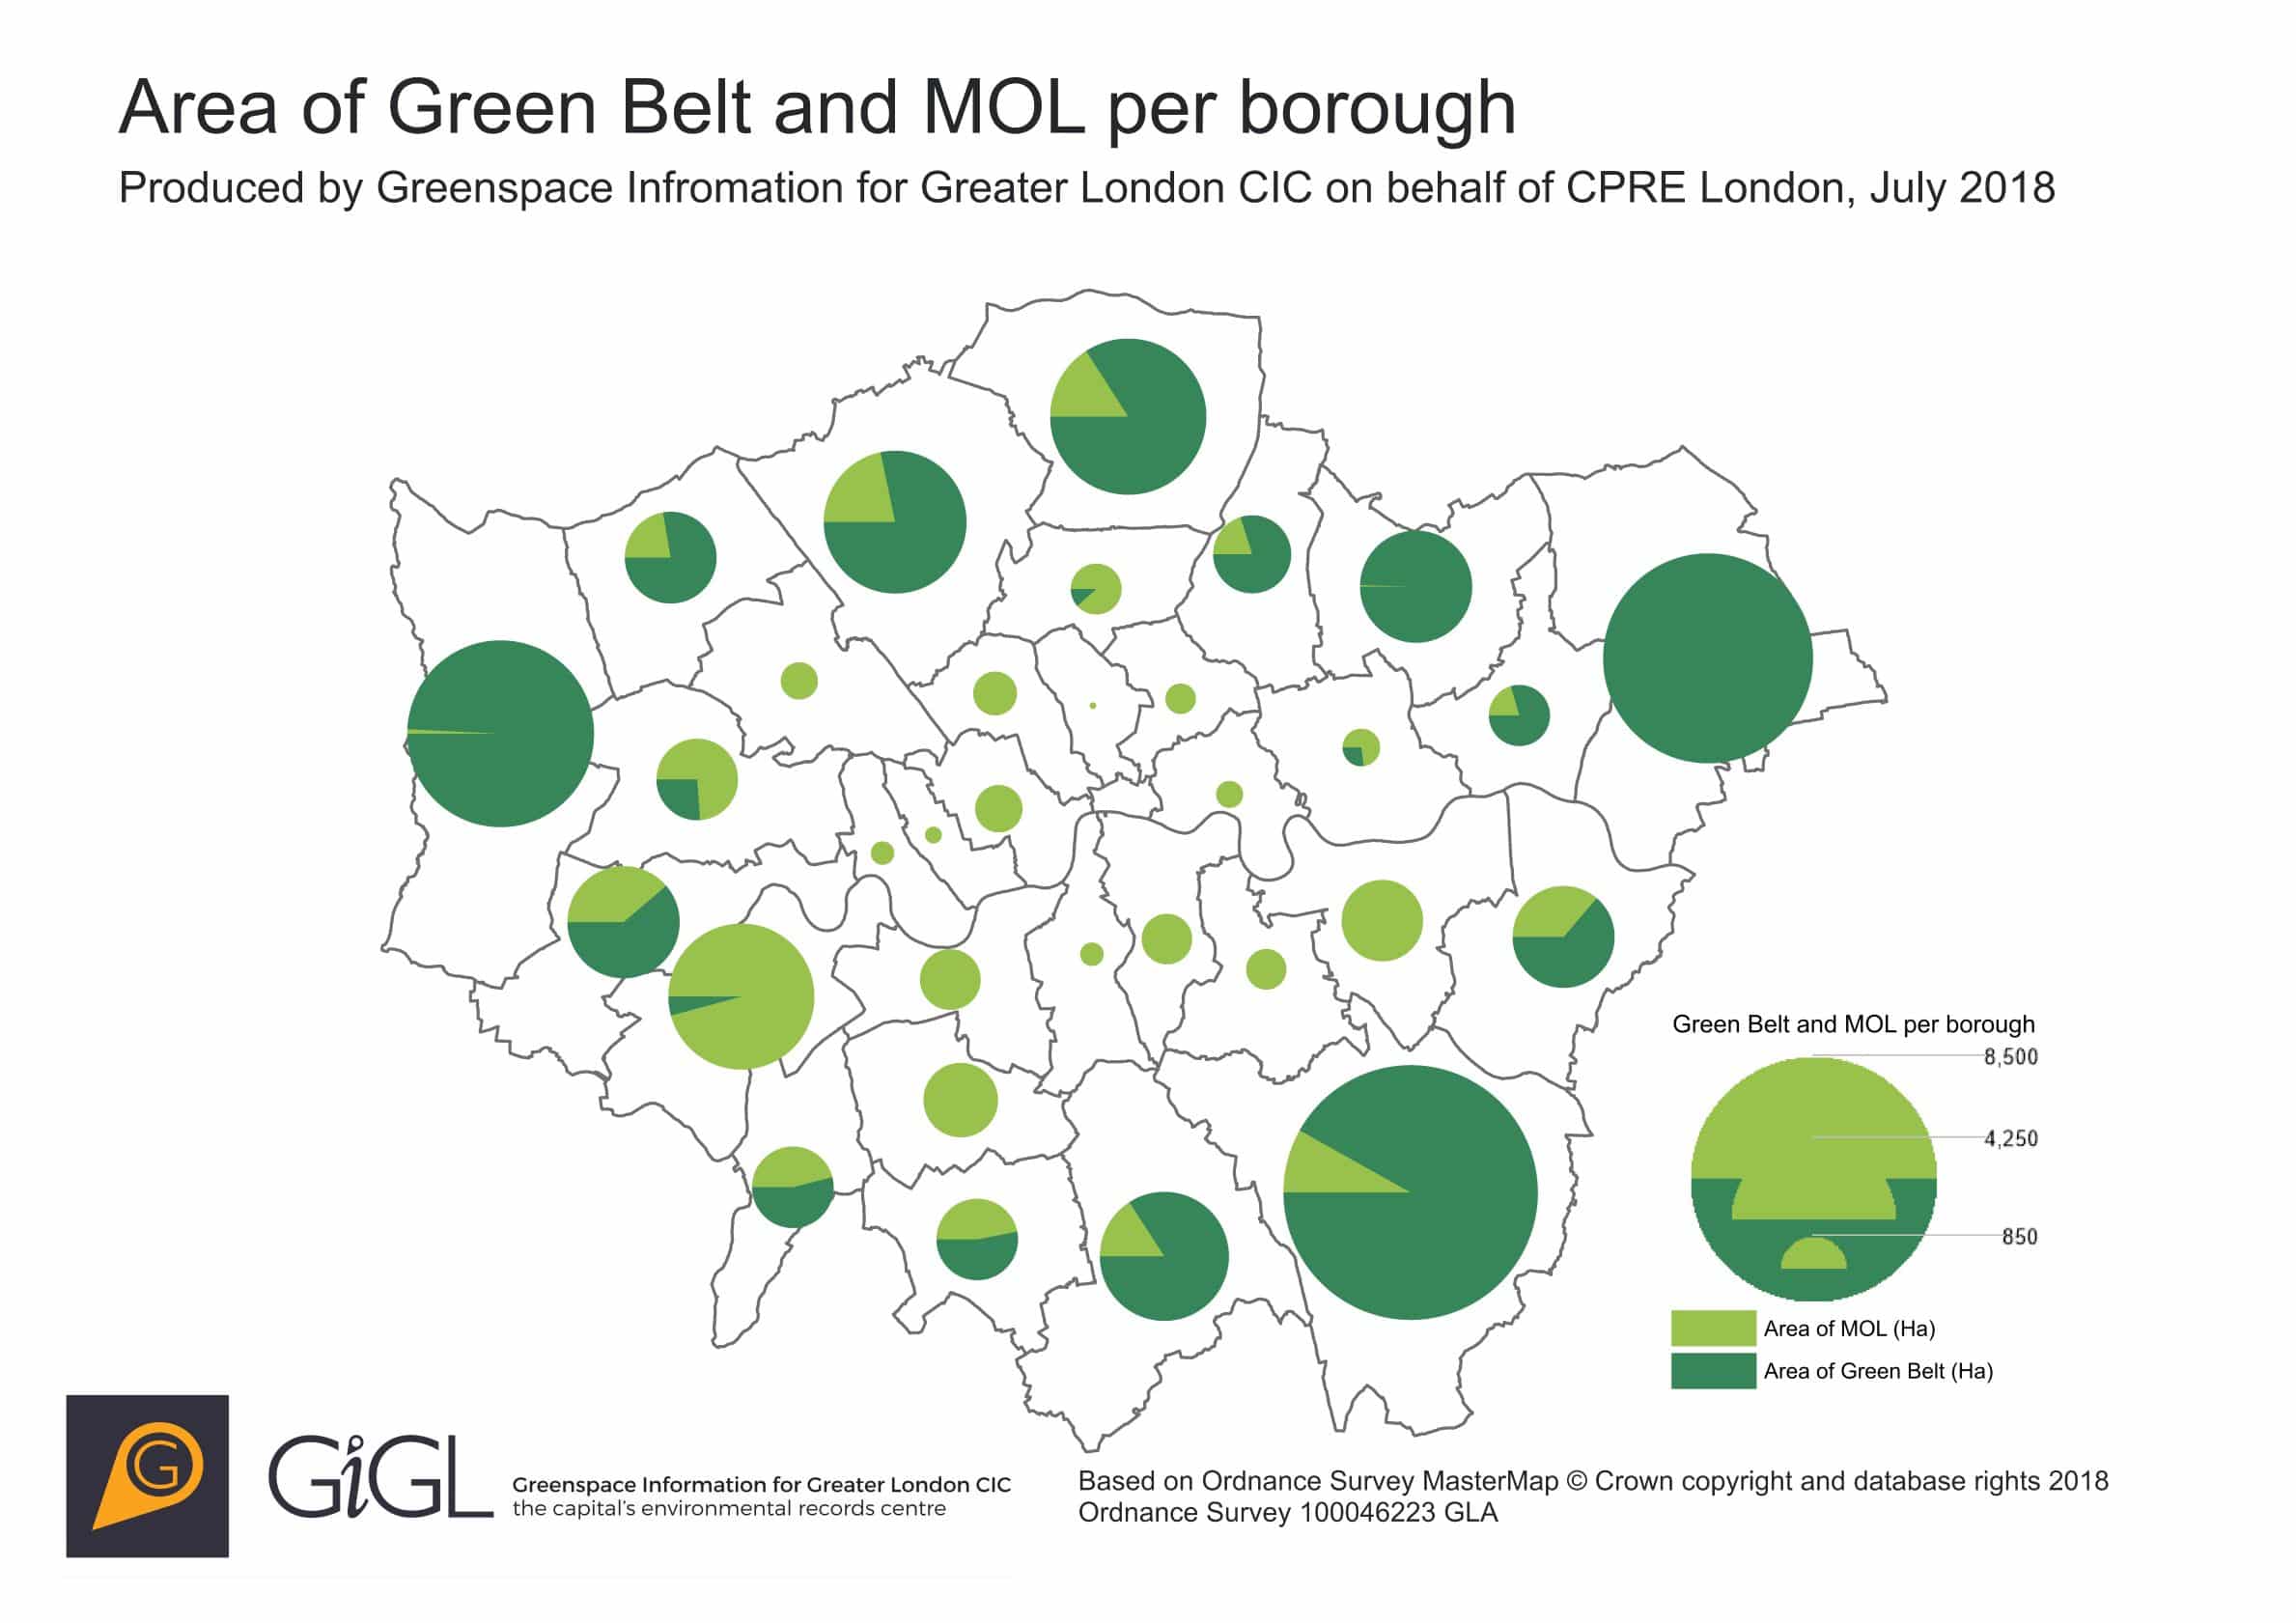
- More than half of the total area of Green Belt within Greater London is found in just three Outer London Boroughs – Bromley, Havering and Hillingdon
- The 12 Inner London boroughs contain just over a quarter (27%) of Greater London’s MOL. These boroughs cover 19.5% of London’s area: Inner London is 14% MOL and 0% Green Belt whereas Outer London is 9% MOL and 27% Green Belt.
- Unlike other Outer London boroughs, Richmond upon Thames has more MOL than Green Belt land, but more than half of the borough’s area falls under one of these designations
- Apart from the City of London, Havering is the only London borough that has no designated MOL
- MOL and Green Belt offers a wide range of different environmental and social benefits
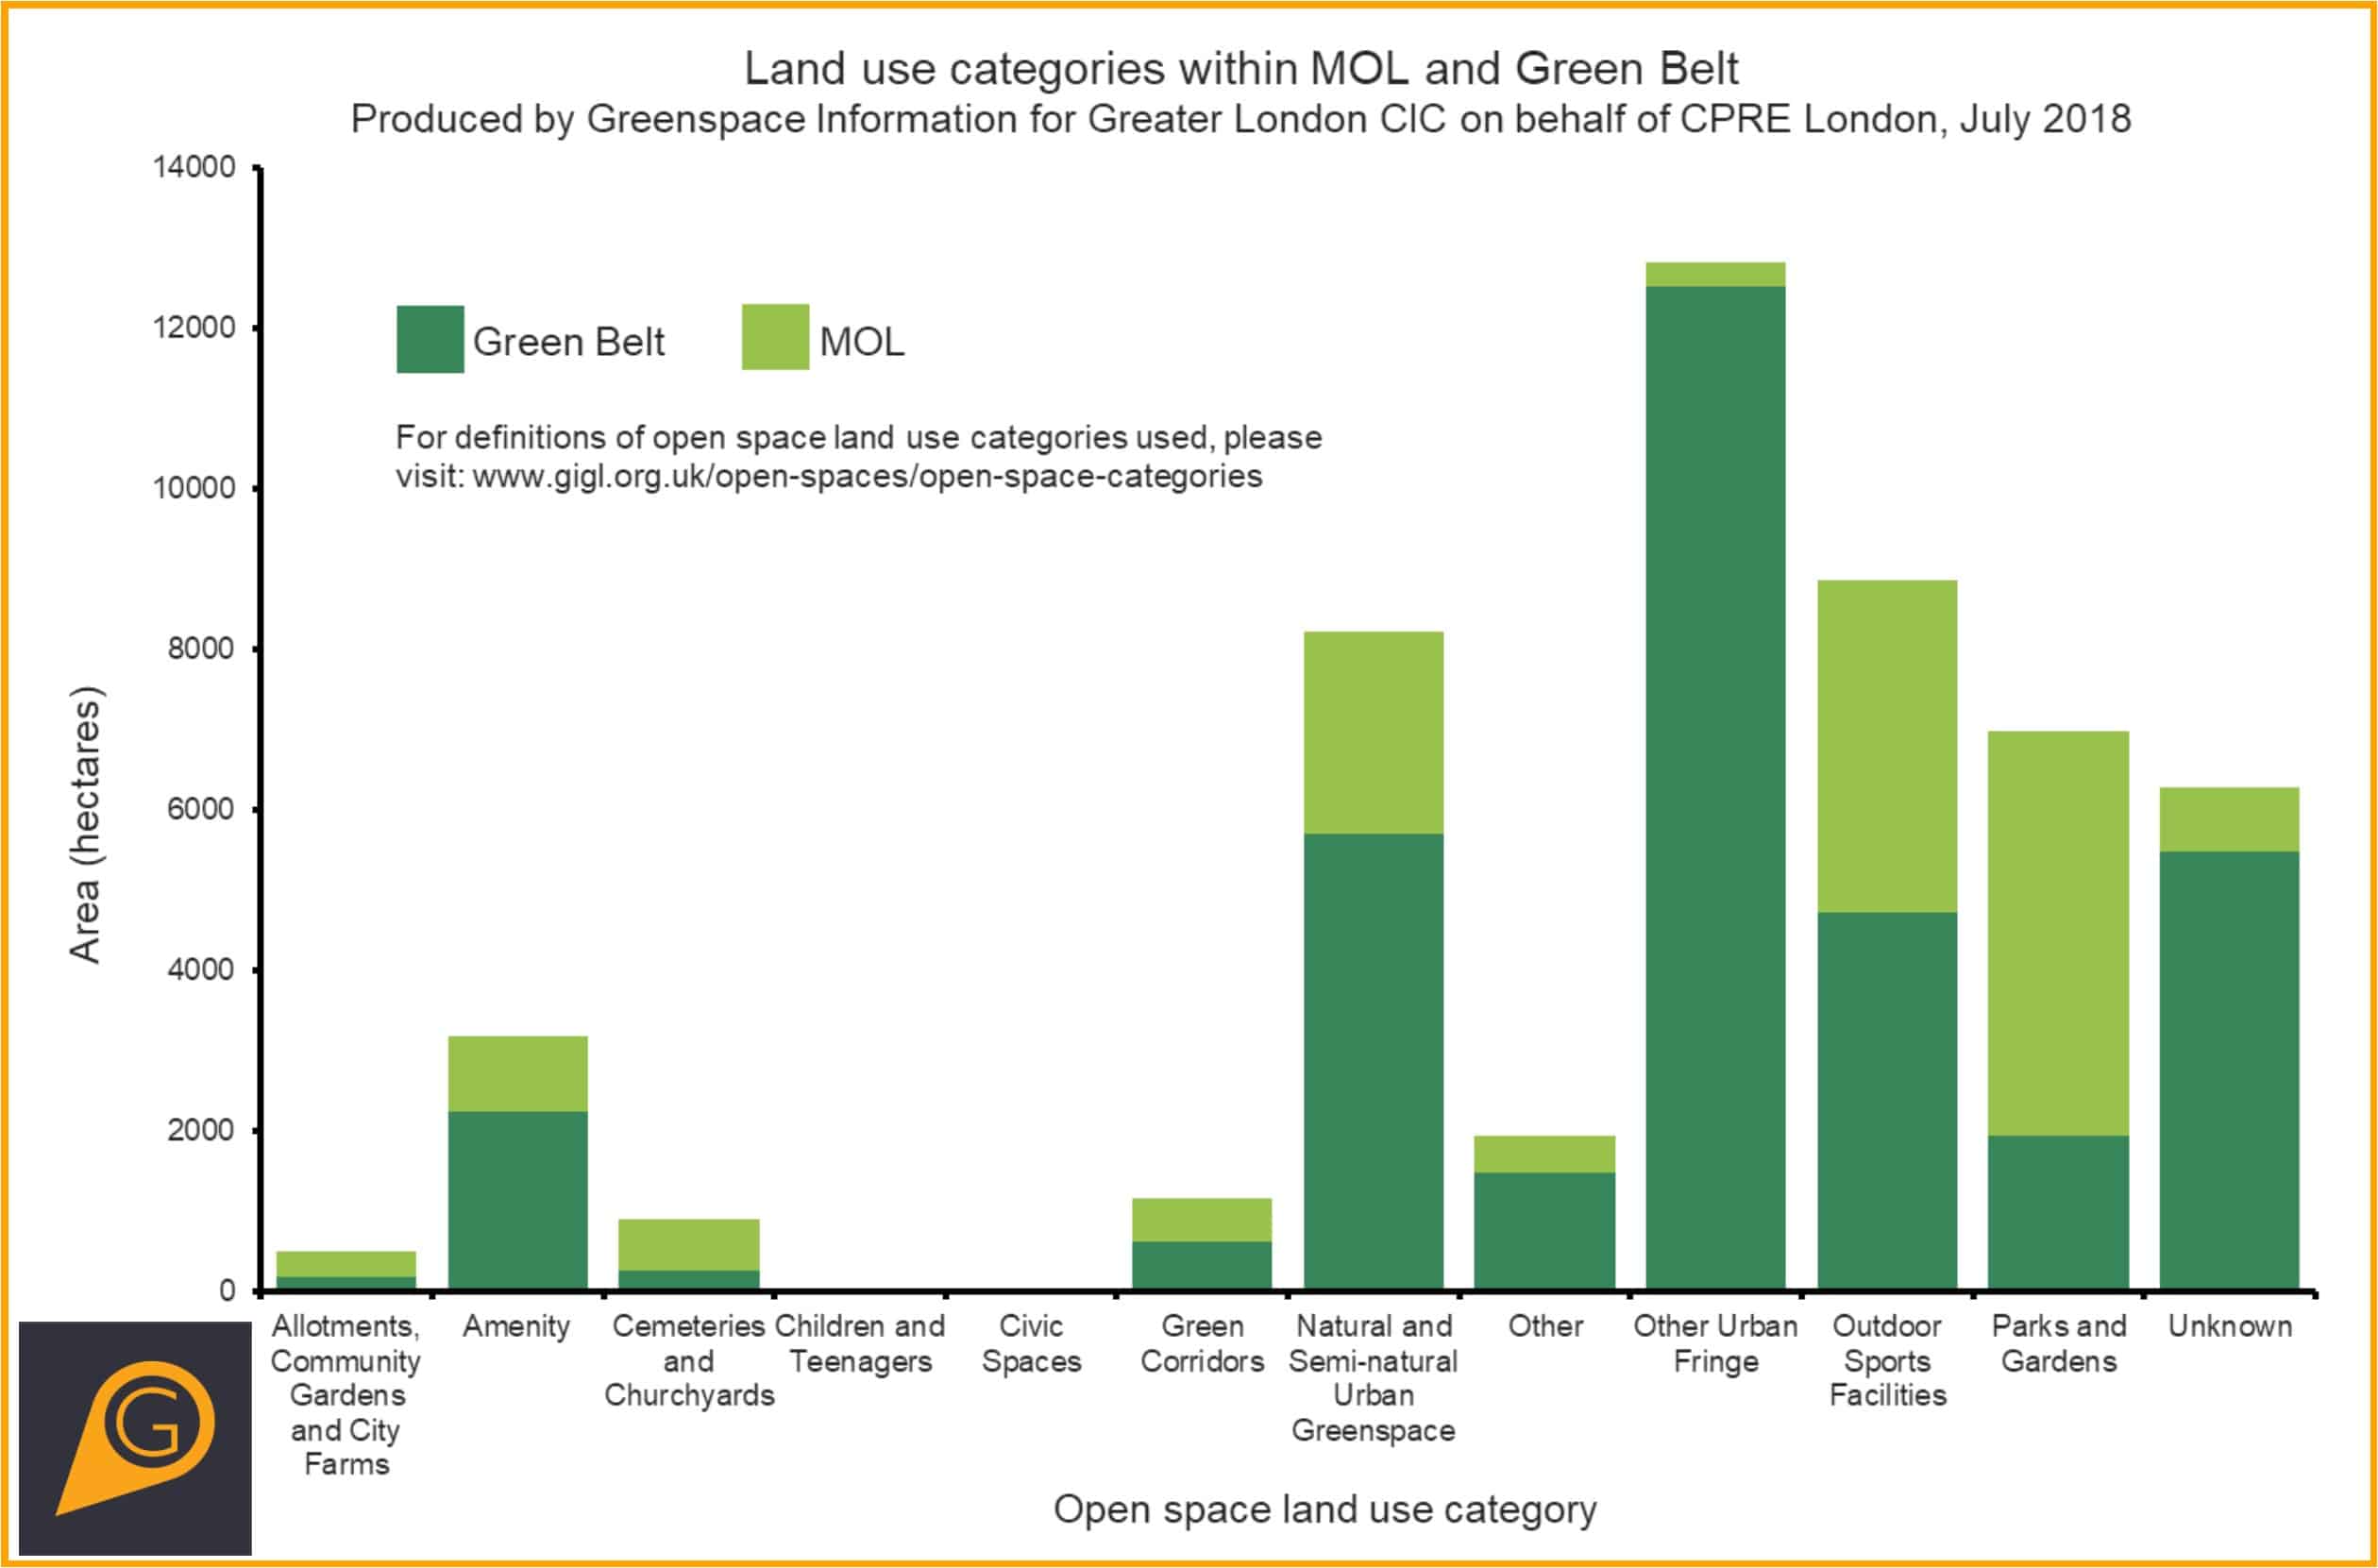
- Outdoor sports facilities account for just over a quarter of MOL and 13% of Green Belt land in Greater London
- A further third of MOL is parks and gardens (not including domestic gardens). Only 5.5% of Green Belt has the primary land use of park or formal garden.
- Urban fringe land uses – such as agriculture, horticulture and equestrian centres – account for just over a third of the Green Belt. By contrast, only 2 % of MOL is urban fringe
- 16% of both MOL and Green Belt in Greater London is commons, country parks, woodland or nature reserves
- 95% of the area of statutory nature conservation sites are within designated Green Belt or MOL
- Of the total area of Sites of Importance for Nature Conservation (SINCs) in Greater London, 59% is not covered by statutory nature conservation designations but is within designated Green Belt or MOL.
- Over 97% of London’s ancient woodland is located in Green Belt and MOL
- Almost 80% of this Ancient Woodland is within just six Outer London boroughs – Bexley, Bromley, Croydon, Enfield, Hillingdon and Waltham Forest – although there is some in four Inner London boroughs – Camden, Greenwich, Lewisham and Southwark
MOL and Green Belt are not distributed evenly across Greater London. Green Belt, by definition, is found around the edge of the city, but all except for one borough and the City of London have additionally designated some MOL. Not all boroughs contain similar areas of designated land. 29% of Greater London’s total area of Green Belt and MOL is found in just two boroughs: Bromley and Havering. There is variation in spread between Outer and Inner boroughs, reflecting London’s development history, and of the area’s different characters. Bromley, Havering and Richmond, all on the edge of Greater London, have each designated 50% of their total area as MOL or Green Belt. In Inner London, the highest percentage of MOL by borough is around 20% – in Westminster, Greenwich and Wandsworth – emphasising that legally protected, high quality open space is a scarce resource for those in the inner city.
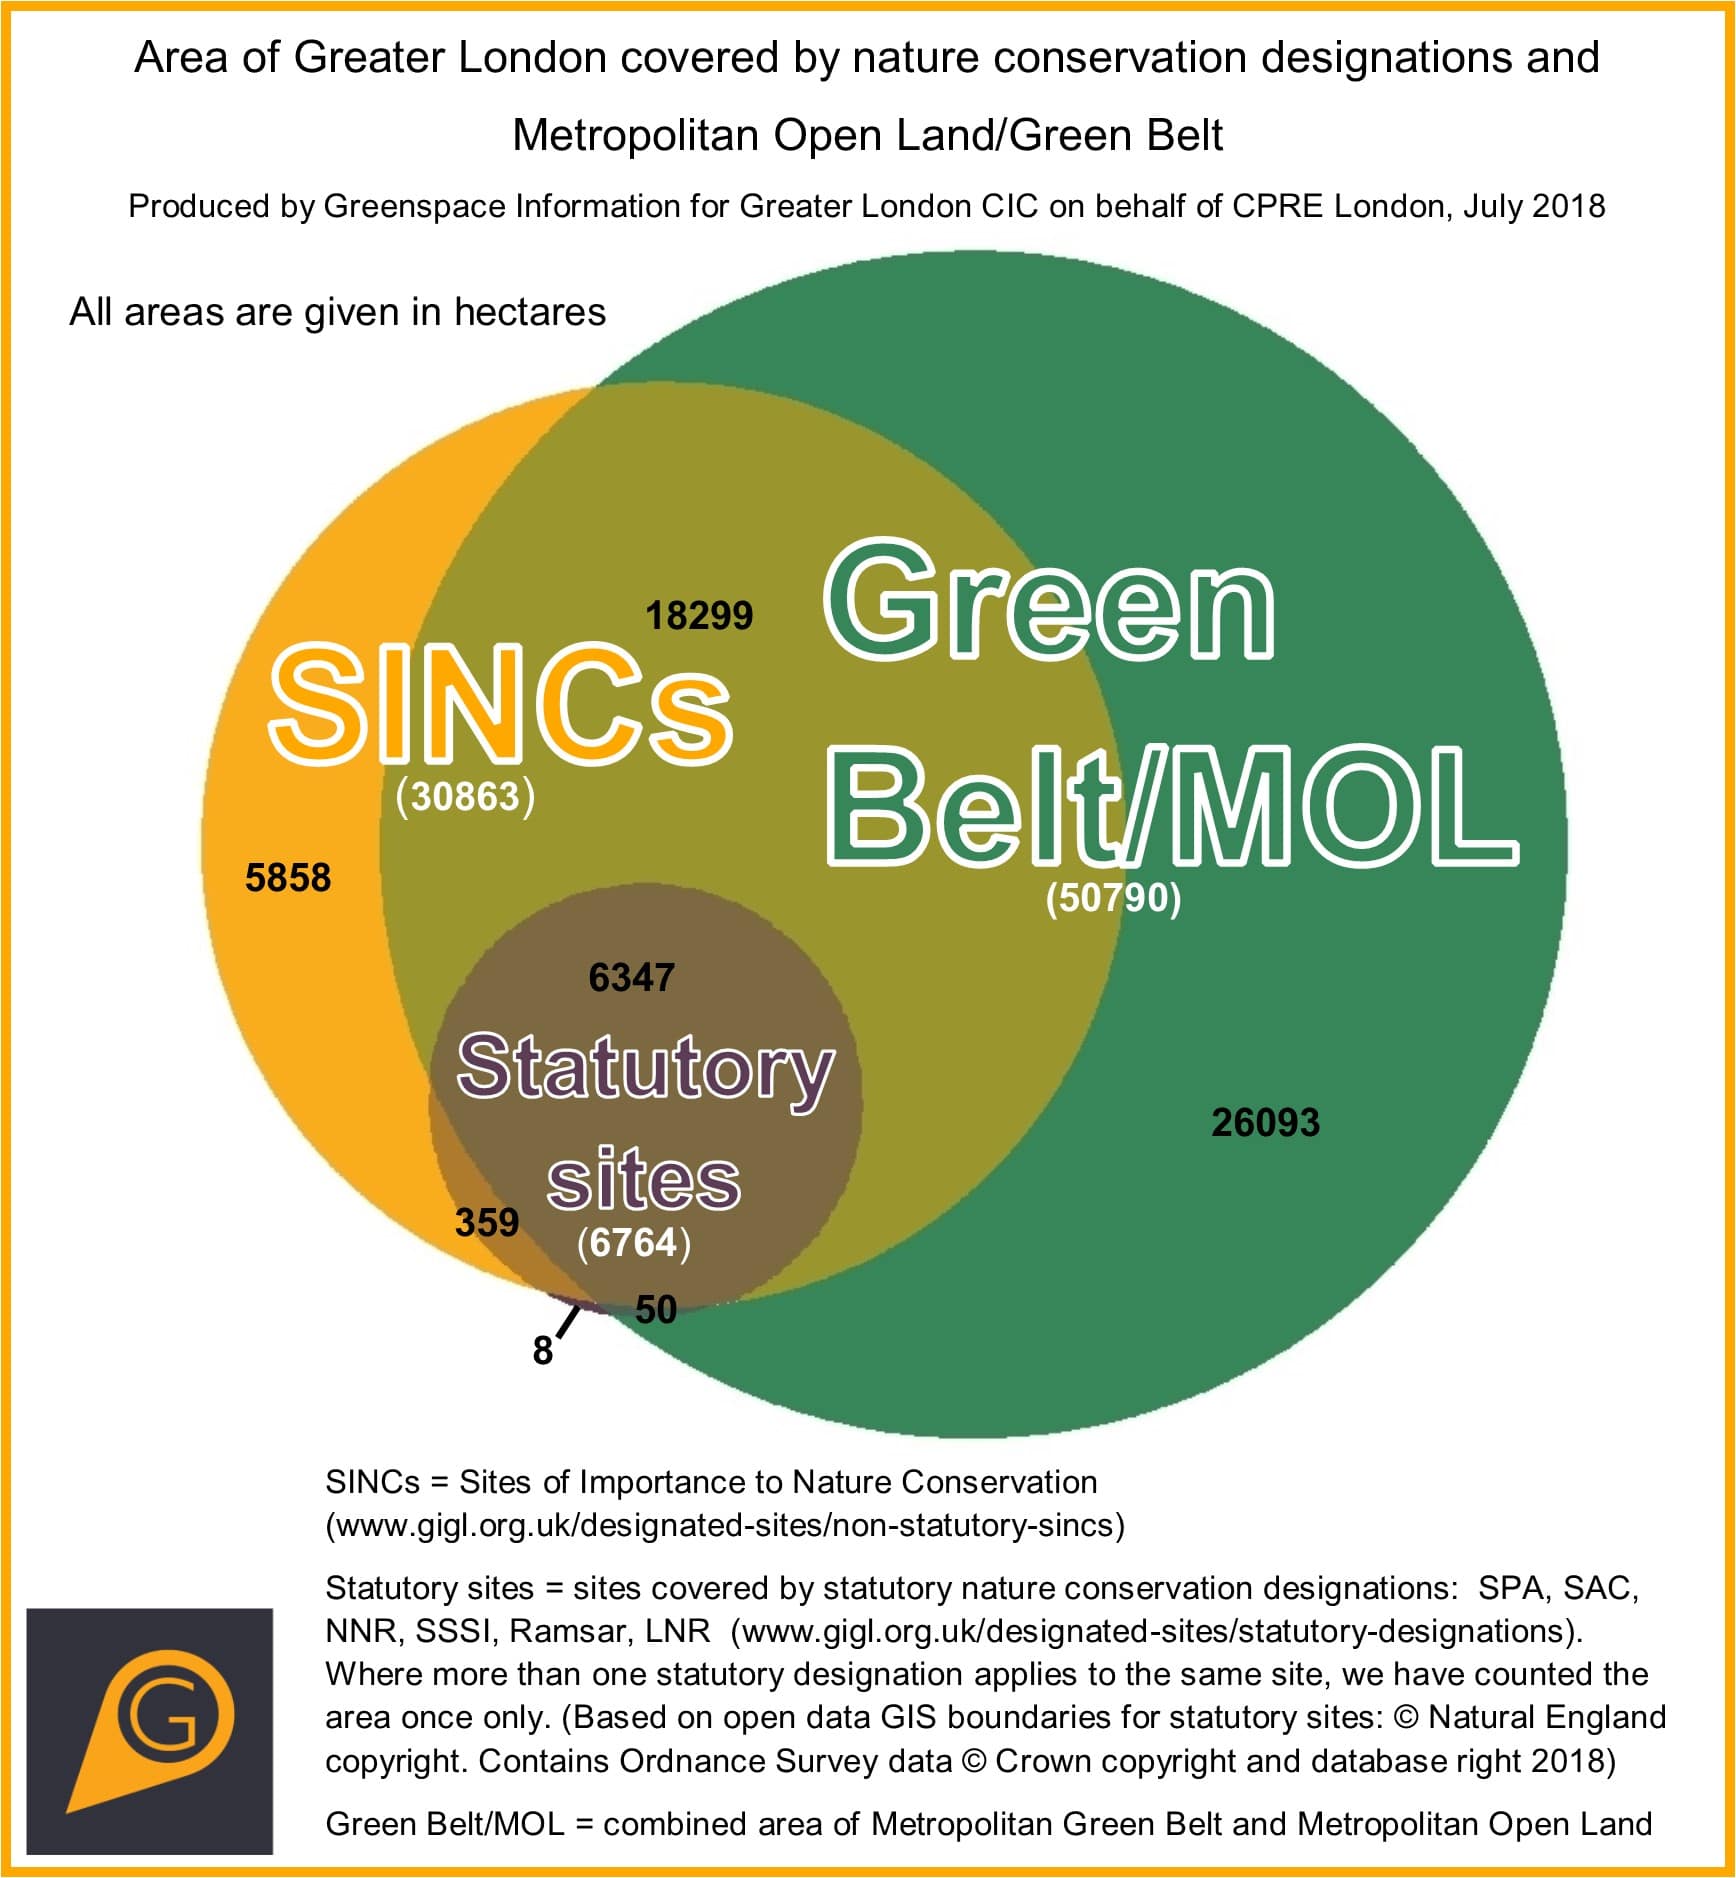
Nearly half of the area of Green Belt and MOL is officially designated as being important for nature conservation. Of all London’s nature sites with statutory protection (including Ramsar sites, SPAs, SACs, SSSIs, National Nature Reserves, and Local Nature Reserves) nearly all (95% by area) are located in areas of designated Green Belt or MOL, constituting further protection for these important areas. Significantly, Green Belt and MOL are also providing enhanced protection for a large proportion of our city’s non-statutorily protected nature sites. As can be seen in the Venn diagram, 59% of London’s Sites of Importance for Nature Conservation (SINCs) fall outside of sites with statutory nature conservation designated areas but are within Green Belt or MOL.
From calculating the overlap of the two designations and SINCs by borough, it’s clear that more of the land in Inner London has multiple designations than in Outer London: 70% of MOL is designated as SINCs compared to only 39% of Green Belt.
Green Belt and MOL also contain the majority of Greater London’s Ancient Woodlands. These are defined as areas that have been wooded continuously since at least 1600 AD. Whilst this habitat is protected by its own national policies, being within designated Green Belt and MOL facilitates these policies being enforced in practice.
It was interesting to analyse what Green Belt and MOL are used for. A noteworthy proportion of both designations are sports facilities: 13% of the Green Belt and 26% of MOL. The predominantly more rural feel of the Green Belt is demonstrated by 36% of its total area being the “urban fringe” land use categories of agriculture, horticulture and equestrian centres. This is in comparison to only 2% of the area of MOL. A third of MOL is managed for aesthetic and recreational purposes as parks and formal gardens, suggesting a more publicly accessible nature to these spaces. Only 6% of Green Belt is parks and formal gardens. These findings are what you might expect from the character of the designations, with the Green Belt preventing urban sprawl and MOL covering more formal areas to provide recreation and leisure opportunities.
Outcomes and future directions
The completeness of the mapping, and having all areas verified simultaneously, means that the datasets can now be used as a baseline to monitor changes to MOL and Green Belt over time.
CPRE London intends to promote the use of the GiGL datasets as the basis for an annual report to document changes to the extent and character of Green Belt and MOL within the Greater London area.
The datasets are available for use by the GiGL partnership with a shared-data licence. One borough provided data for use in the report only, so their data has not been added to the GiGL database for future use, but data for all other boroughs are included. GiGL will continue to check for changes to these data on a regular basis, so that the resource remains a reliable representation of these valuable sites. CPRE London’s report includes a recommendation that local authorities and land managers work with us on this.
The updated datasets make it possible to get an overview of MOL and Green Belt across London, generate accurate statistics and make valid comparisons between different areas. It enables us to have increased confidence in information based on these datasets, bringing them up to speed with the rest of the GiGL database as a reliable resource that can be used for many and varied purposes. Also, filling the gaps in the MOL dataset means that it can now be included in our data search service so that developers and conservationists are made aware of designations affecting the sites they are working on.
Great to work with Julie and Emma from GIGL on this vital project. This article summarises the findings well. Neil, (Director, CPRE London)