Through projects with our partners and our ongoing support of researchers, GiGL has facilitated a number of investigations of the collated species data at a London level. This enables us to see patterns of recording in Greater London; visualising hotspots and gaps both geographically and over time. We hope that some of these analyses and maps will be a useful resource for recorders as well as demonstrating the impact of the collated dataset.
Comparison of recent and historic recording
GiGL species database records are managed so that a separate protected and notable species dataset is maintained. We have compared these records with 1km grid squares according to date, revealing those squares without recent (last 10 years) records. The analysis resulted in the following map.
-
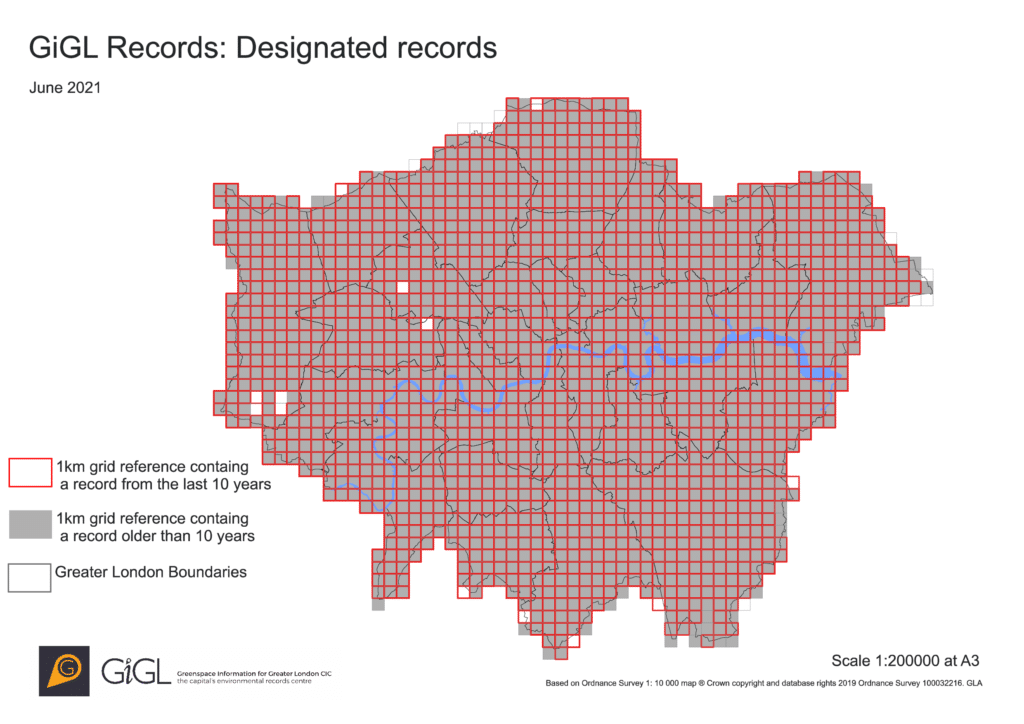
- GiGL records: All designated and notable species

This map shows the importance of almost all of Greater London for designated and notable species, but also demonstrates the terrific work of London’s recording community. These GiGL records are informing decisions across London so it’s great there is such wide coverage. What about the 1km grid squares where no designated or notable species have been recorded, or where they have been found historically but not within the last 10 years? Do these areas not contain any designated or notable species, or is it that no-one has submitted any records from there? A challenge for London’s species recorders perhaps?
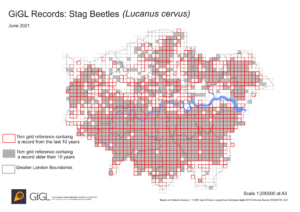
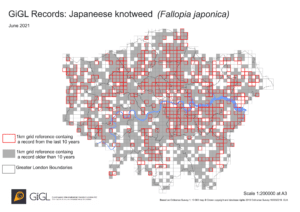
We have also used this approach to study the records of some taxonomic groups and individual species distributions. While the patterns displayed on the below maps vary, the distributions probably reflect recording effort as much as actual species distributions. We hope the maps will be useful in showing the recording gaps which exist for different species, and inspire recorders to survey in those gap locations and submit their sightings to GiGL. Remember you can submit your species sightings online here, or get in touch.
-

- GiGL records: Stag beetle
-
- GiGL records: Japanese knotweed
Other investigations of recording
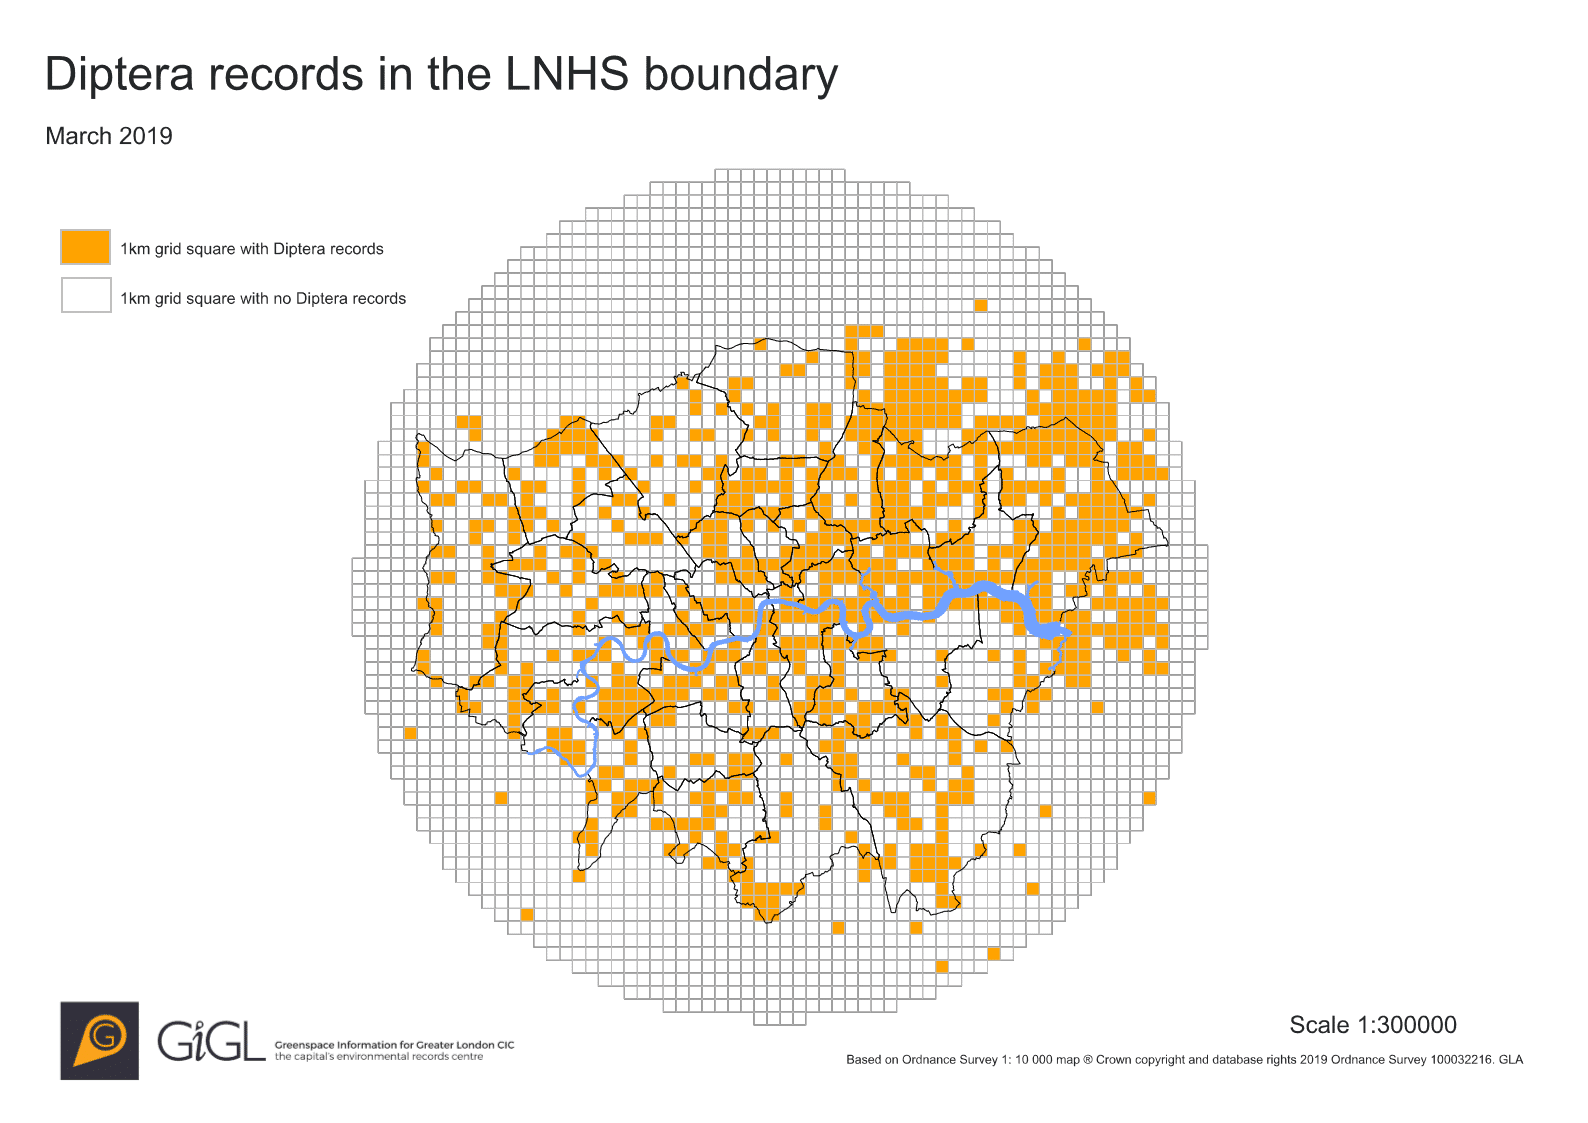
We have had the opportunity to trial an approach to gap analysis with a Diptera recorder in London. We produced the displayed map and a list of recorded 1Km squares for Diptera in March 2019.
Another example of where atlas style maps have been used to highlight species distributions and recording gaps is the Connecting London’s Amphibian and Reptile Environments project.
The collated species data can be analysed in other ways too, and GiGL records have provided analysis opportunities for a number of citizen science focused research projects. This GiGL newsletter article introduces research that GiGL data is supporting, investigating cultural ecosystem services by analysis of volunteer generated species records.
Please get in touch if you would like downloadable copies of the maps or a list of squares with only historic records. We’d also be interested to hear your suggestions for other records we can analyse to assist your recording, or if you’d like to discuss what the maps show us.