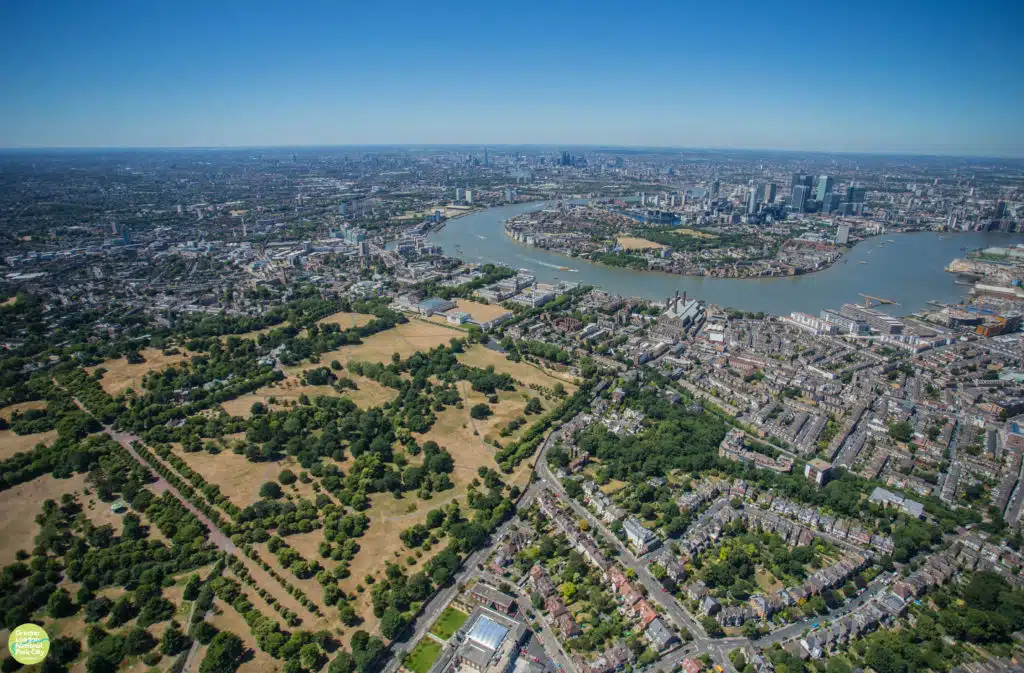
London is a green city, with approximately 33% of London consisting of green open space. These green spaces are critical for London’s health and well-being, however not all Londoners have equal access to them. In his 2021 manifesto the Mayor pledged to ‘improve London’s network of green corridors and open spaces so that more Londoners live within a 10-minute walk of a green space’.
In order to make this happen, the Mayor first needs to know what areas within London are more than a 10 minute walk from a green space. That is where GiGL, as London’s Local Environmental Records Centre, comes in.
GiGL is not only the custodian of environmental data on species, habitats and open spaces, but we have also developed a model that generates maps of Areas of Deficiency (AoD), which are areas outside of a specific walking distance from sites that meet particular criteria. The model is used in two of GiGL’s core datasets: Areas of Deficiency in Access to Nature (SINC AoD) and Areas of Deficiency in Access to Public Open Space (POSAoD). It can also be configured to map areas outside any walking distance to any type of space, a flexibility that the GLA can make great use of as a service available to them as an SLA partner.
The first stage of making the 10-minute map was to identify suitable sites to measure walking distance from. GiGL’s Spaces to Visit (StV) dataset was chosen as the basis of the map as it is the most comprehensive open dataset of accessible open spaces in London, including all publicly accessible green space that might be worth a visit. StV is a subset of GiGL’s Open Space dataset and is made available free via the London Datastore to support our communities’ understanding of London’s green spaces.
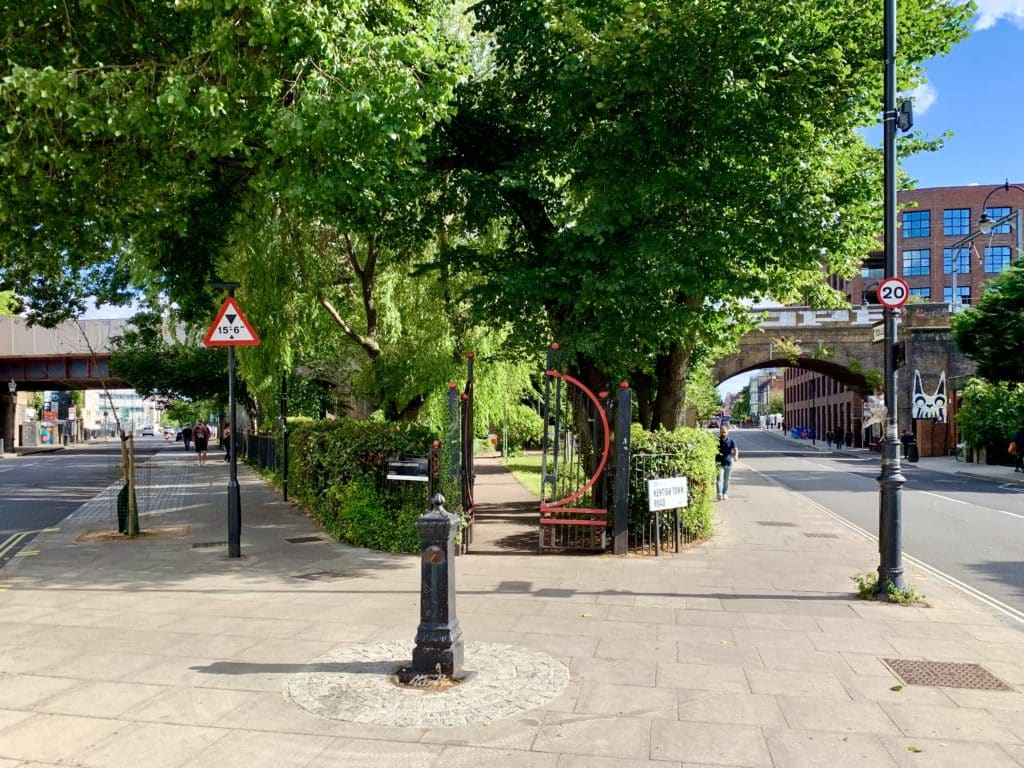
GiGL Spaces to Visit dataset
A subset of GiGL’s Open Space dataset that shows paces in London that are provided to the public as destinations for leisure, activities and community engagement, including green corridors that provide opportunities for walking and cycling.
Available with full boundaries and reduced attributes via the London Datastore and available with full boundaries and complete attributes via an SLA agreement with GiGL.
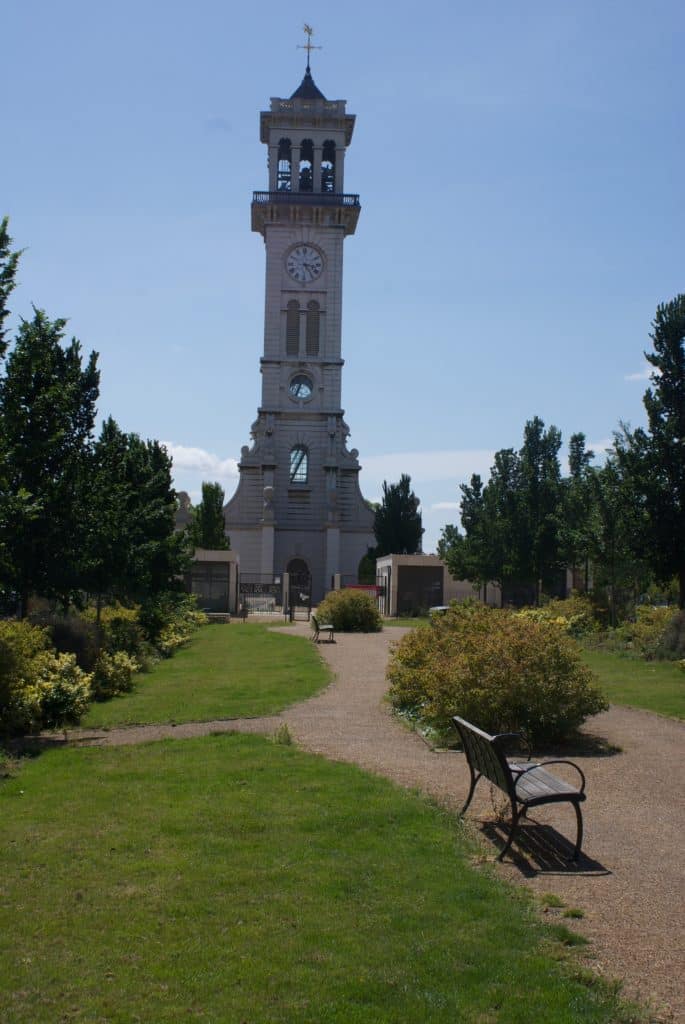
Caledonian Park, one of Islington’s largest green spaces (© Richard Welpton)
GiGL’s StV dataset was further refined to exclude sites that are unlikely to be green. Sites categorised as ‘Civic/Market Squares’ were removed as these are usually hard surfaced, and ‘Rivers’ and ‘Canals’ were removed as these are primarily blue spaces (occasionally with some areas of bank or towpath included in the boundary).
The GLA wanted to establish a minimum size of green spaces that would be counted, and after some testing, 0.02 hectares was settled on. This is roughly the size of a tennis court and while Londoners would ideally have good access to much more green space, was considered a reasonable measure of what the absolute minimum should be. No minimum size is defined in the London Plan’s existing Public Open Space categorisation (on which GiGL’s POSAoD model is based) as the definition of a pocket park is ‘less than’ 0.4 hectares. The 0.02 hectare threshold originally comes from guidance associated with a Ministry of Housing Communities and Local Government (MHCLG) Pocket Park funding scheme.
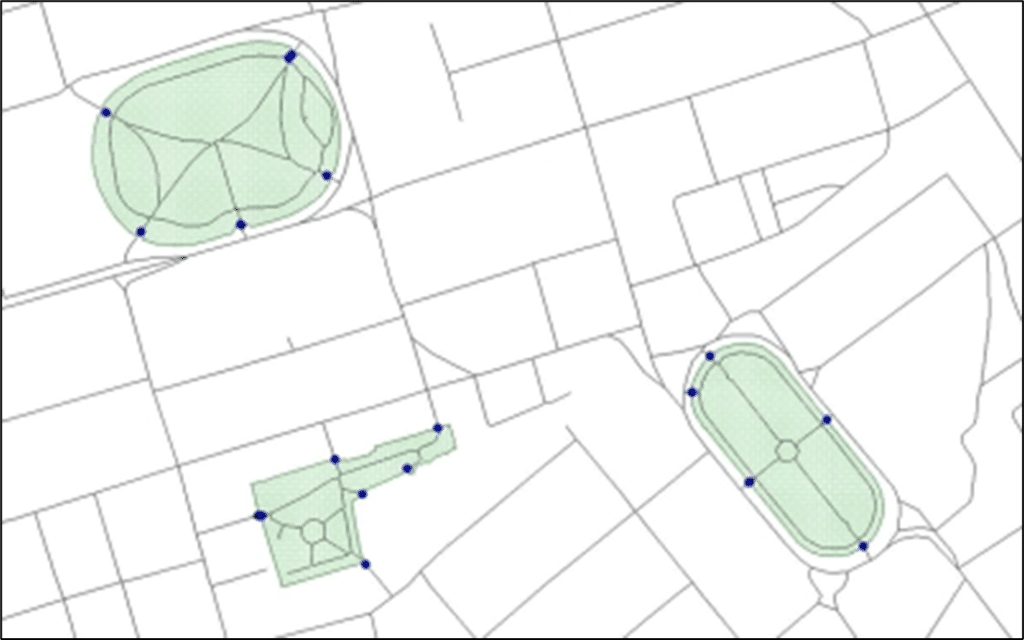
The GLA then asked that an 800 m walking distance was used to represent how far someone walking at average speed can travel in 10 minutes. In order to calculate this walking distance accurately, GiGL used Ordnance Survey Highways Network data to ensure that the model followed the most up to date and accurate walking routes. The majority of these points are automatically identified by the model where roads and paths cross into a site boundary. However, 1,130 sites didn’t overlap with the network and needed points added in manually. With the timescale and resources available, it was agreed that GiGL would identify and add access points for sites over 2ha in size only. For the remaining sites, ‘access points’ were considered the centre of each site, which would lie no more than 40 m from the site boundary.
In the process of adding manual access points, GiGL identified a number of sites that seemed to be no longer accessible or had no identifiable access points. These were removed from the model so that AoD was not underestimated, and areas that might be in need of improved green infrastructure were not overlooked. We expect some of these sites to be added back into the model as their access is confirmed through liaison with Local Authorities.
So, having selected the sites, checked the access points and agreed a distance, GiGL set about running the AoD model and produced the AoD layer that forms the basis of the 10-minute walk map. This was then further filtered by the GLA to exclude areas that weren’t populated (using the occurrence of residential addresses), and then converted into a grid map showing areas with the least access and therefore highest priority in terms of greening. You can see the map below, and an interactive version can be found on the GLA website here.
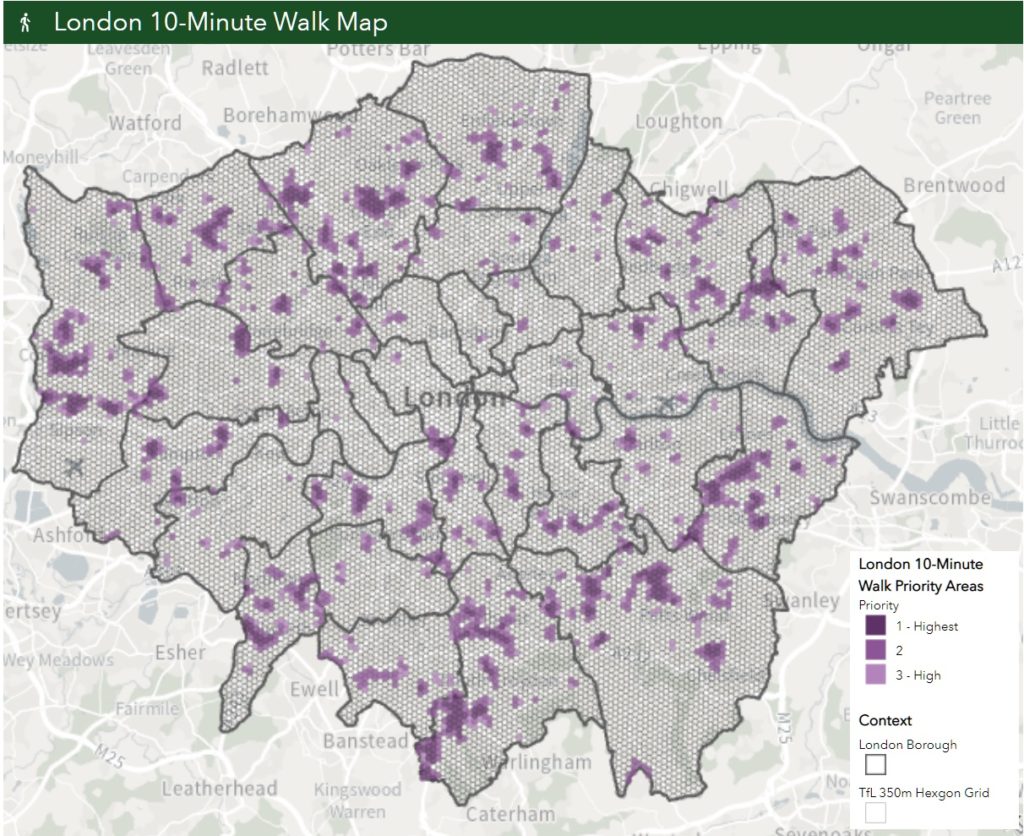
This map will help the GLA target areas in most need of investment in green infrastructure, and help the Mayor fulfil his manifesto commitment to making sure all Londoners have easy access to greenspace. It has already been used to help prioritise applications to the Mayor’s Grow Back Greener Fund and Green and Resilient Spaces Fund, and will be used to help monitor the impacts of the Mayor’s green infrastructure interventions.