Green spaces and biodiversity hold a wealth of importance in London. They are vital for conserving species, enhancing climate resilience, improving health and wellbeing, providing amenity space, and much more! Additionally, there are a wide range of sectors, organisations, and individuals working to enhance nature to achieve these social and environmental impacts.
GiGL’s specialism as environmental data stewards and analysts allows us to unlock insights with comprehensive datasets in order to help others understand, study, protect, and improve the natural environment. Sometimes going a step further and integrating cross-sector data can help us gather an even deeper understanding of our urban systems and services.
This article explores the insights we can produce by combining the environmental data that GiGL hold with datasets from other organisations and platforms. We’ll focus on data from these categories…

For each of the above, we’ll showcase some mapping and analysis we’ve done in the past as well as what we are capable of doing at your request. Interpretational analysis with external data is something we can offer to all our stakeholders, so please get in touch if you have an innovative idea for how we can help you.
London’s evidence base is constantly progressing, especially as new technologies and initiatives emerge. Many datasets are made available via trusted sources like ESRI’s Living Altas and the London Datastore, and key organisations such as Ordnance Survey, the Office for National Statistics, the Met Office, and various government bodies.
At GiGL, we access datasets through various means and have a good understanding of how to apply them effectively, whilst following any licensing and copyright requirements. Some of these data are open source, while we have privileged access to other data as London’s local environmental records centre. ‘Accessible’ and ‘open’ might sound like a subtle distinction, but here’s the difference:
Accessible vs Open Data:
Open data is free for anyone to use, change, and share for any reason.
Accessible data means the data is available to use through various means, but there may be some rules or restrictions on how you can use it.
Data accessibility is part of the FAIR data principle, which stands for Findable, Accessible, Interoperable, and Reusable. These principles help make sure data can be used while protecting integral processes and organisations that go into stewarding the data.
Here’s how those data could integrate with GiGL’s…
Population, demographics and health
In recent years, the provision of good open space for Londoners has become an increasingly high priority. The London Plan includes dedicated policies to support this goal, and many Borough Councils are actively working to improve both the quality and accessibility of these spaces. At GiGL, we help by mapping areas of deficiency (AoD) in access to nature and Public Open Spaces. This mapping supports our networks and provides the information they need to plan improvements in access and quality of spaces.
It’s particularly helpful to look at areas with high population density or where specific demographics may be more in need. Below, you’ll find a map of wards in London, where AoD are mapped in relation to population size. Darker areas indicate a higher percentage of AoD and a larger population – a potential indication of those areas in need of most improvement.
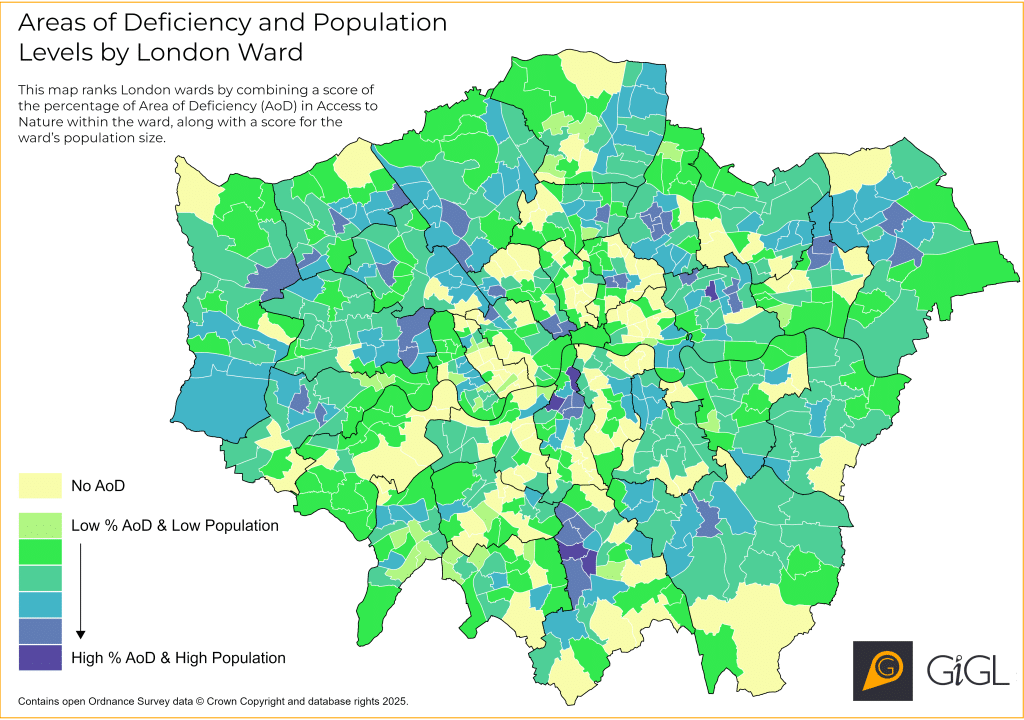
These data could also help us identify communities where accessible spaces are limited but crucial. For example, areas with large numbers of children who need play spaces. Using age population stats from Census 2021 data and GiGL’s open space dataset, we can pinpoint locations where play space improvements could deliver maximum benefit to younger populations.
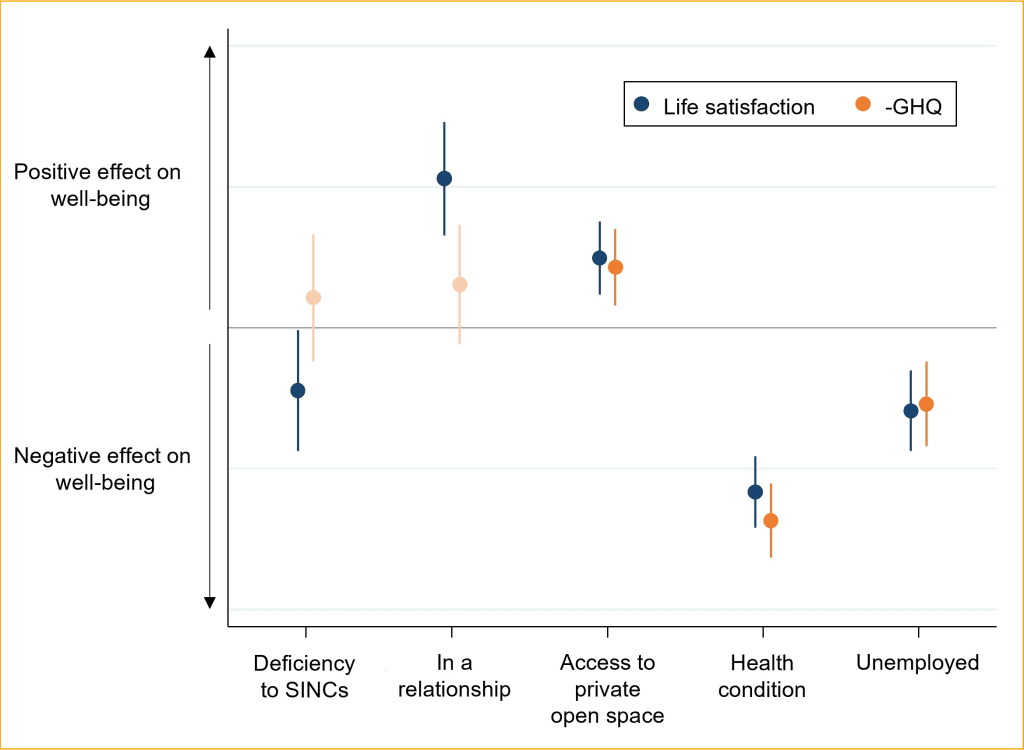
Since the COVID-19 pandemic, the importance of high-quality open space for mental health and wellbeing has become even more widely recognised. In recent years, this topic has gained strong interest among researchers and students accessing GiGL’s data. One deep dive into this issue was carried out in 2022 by researcher and GiGL advisory panel member Dr Sarah Knight. Her work explored how high-quality natural spaces contribute to wellbeing, drawing on multiple GiGL datasets. You can read more about her findings here:
The importance of high-quality natural spaces for well-being
Gardens
Private gardens play a vital role in supporting London’s nature networks, offering essential connections between green spaces and valuable habitats for wildlife. However, because these gardens are privately owned, it can prove difficult to fully assess their value without knowing more about their composition or maintenance.
Over the years, GiGL has contributed data expertise to several projects aimed at better understanding this often-overlooked resource. One of the earlier examples was a 2011 in-depth study with the Greater London Authority (GLA) and London Wildlife Trust (LWT), which mapped the change of London’s gardens between 1998 and 2008. The findings were published here: GiGL Publications – London: Garden City?
Private gardens are also integrated into our Ecological Network Mapping, helping to identify potential green corridors that already exist or could be enhanced. Gardens, though small, can create powerful connections when considered as part of a wider ecological network. This is something that many organisations are coming to recognise as a priority.
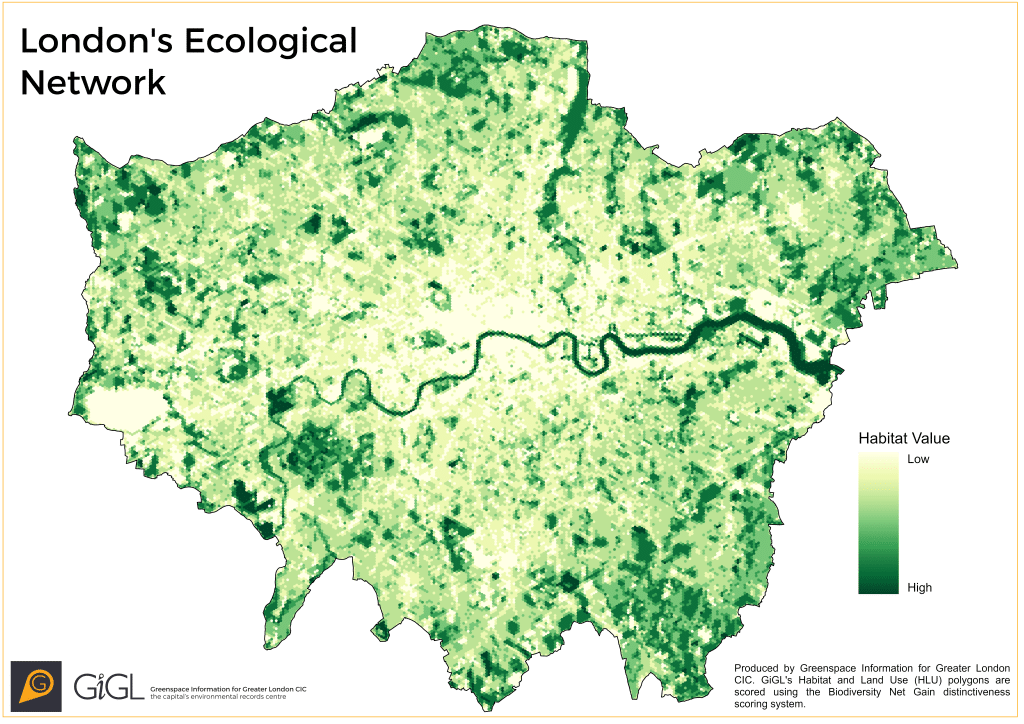
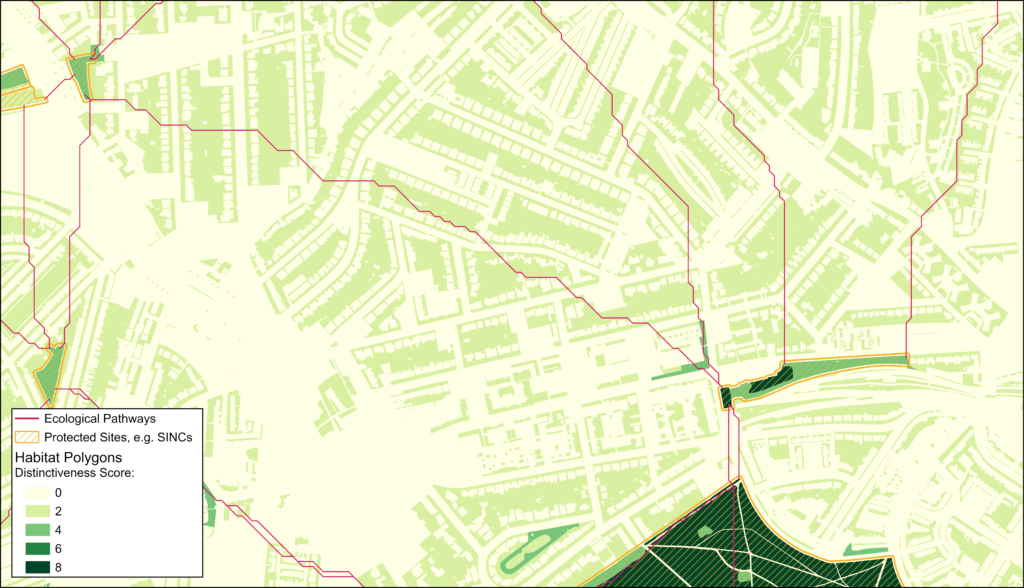
In recent years, garden data has been used by our partners to support local priorities. We helped Sutton showcase their garden resource in 2022, finding that gardens contribute more area in the borough than SINCs do. The borough therefore focuses their efforts on community engagement to help people interact with the nature on their doorstep, similar too to the Wandsworth ‘On Your Street’ Garden Survey that we also supported.
Transport and Infrastructure
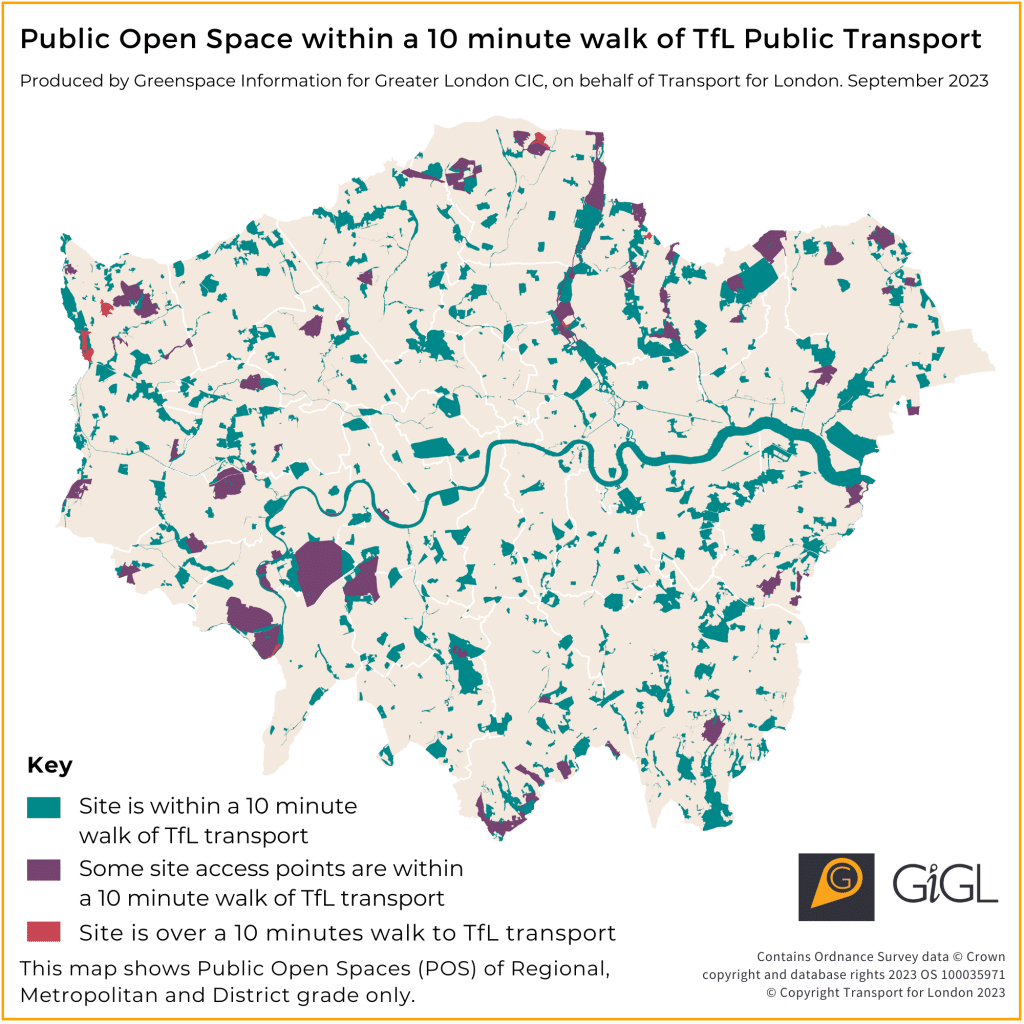
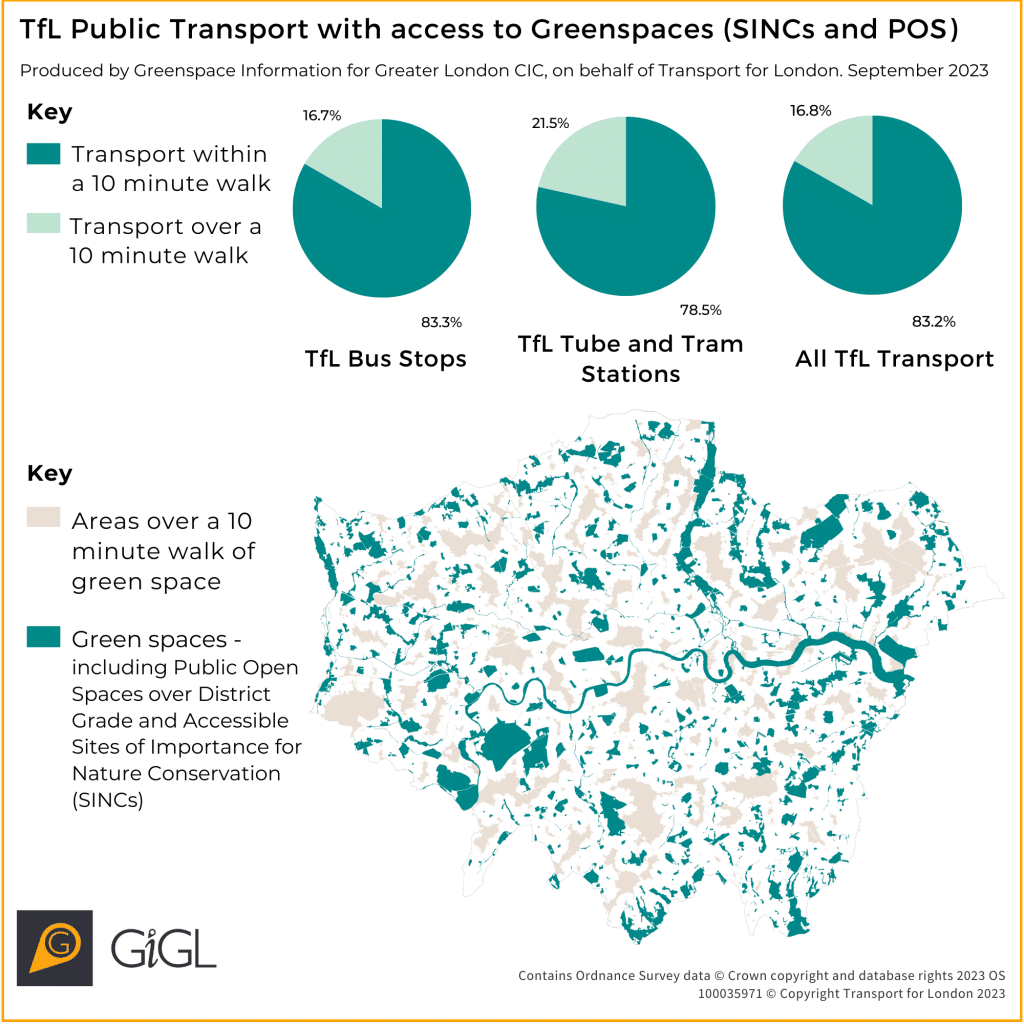
Where our areas of deficiency analysis considers walking distances alone, it’s also important to consider other routes of access too. London’s transport network is comprehensive, with buses, tubes and trams allowing Londoners to explore green spaces – but which spaces are underserved by public transport? Our Transport for London partners asked us just this in 2023, and we ran analysis for their Green Infrastructure and Biodiversity Plan to indicate public open spaces that are harder to reach via their networks.
Building data has also – perhaps more surprisingly – come into the limelight recently. We’ve worked with Pollinating London Together (PLT) to gather stats on building height data from Ordnance Survey for the roof gardens they survey. This will help them investigate whether roof top height is an important factor in designing great spaces for pollinators and enabling travel between spaces.

We’ve also been working with City of London to understand how buildings of certain archetypes and age could be incorporated into bat suitability mapping. Paired with data on open spaces, streets, and trees, we will be creating a map to highlight important areas for bat roosts, foraging, and travel. Watch this space for more news on that!
Climate, flood, trees and heat
We can integrate climate data into our mapping to support smarter strategies and target areas at most need. As London becomes more at risk of overheating and flooding, we can use GiGL’s habitat and species data, along with canopy, heat and flood risk indices to help prioritise where green infrastructure and biodiversity could have the greatest impact on resilience.
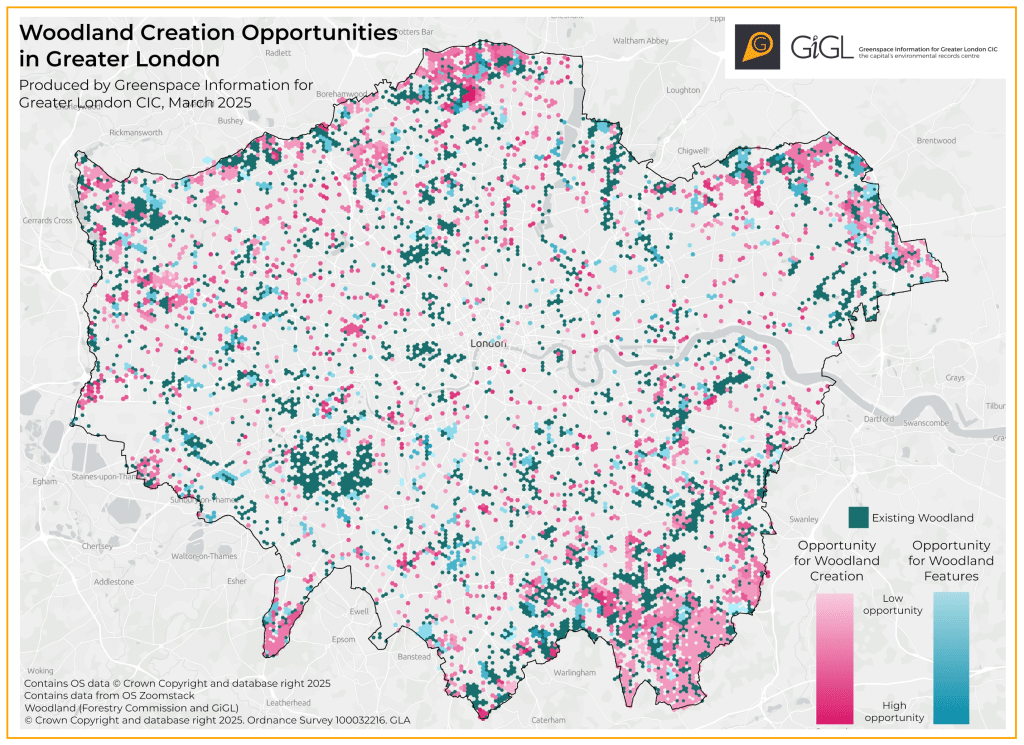
In our Woodland Opportunity Map, we include flood risk as one of the key factors. High risk of surface water flooding boosts the overall opportunity score to show where woodland creation could be targeted to help reduce this. This map is available on Discover London.
Geology and soil
Understanding the lay of the land and its components is crucial to shaping the natural environment. Specific soils are the only places where certain plants can thrive, such as some of those ‘worthy plants’ found on the Axiophyte list. Likewise, geological features influence where habitats can be created or may be at risk. So why use species and habitat data without considering them?
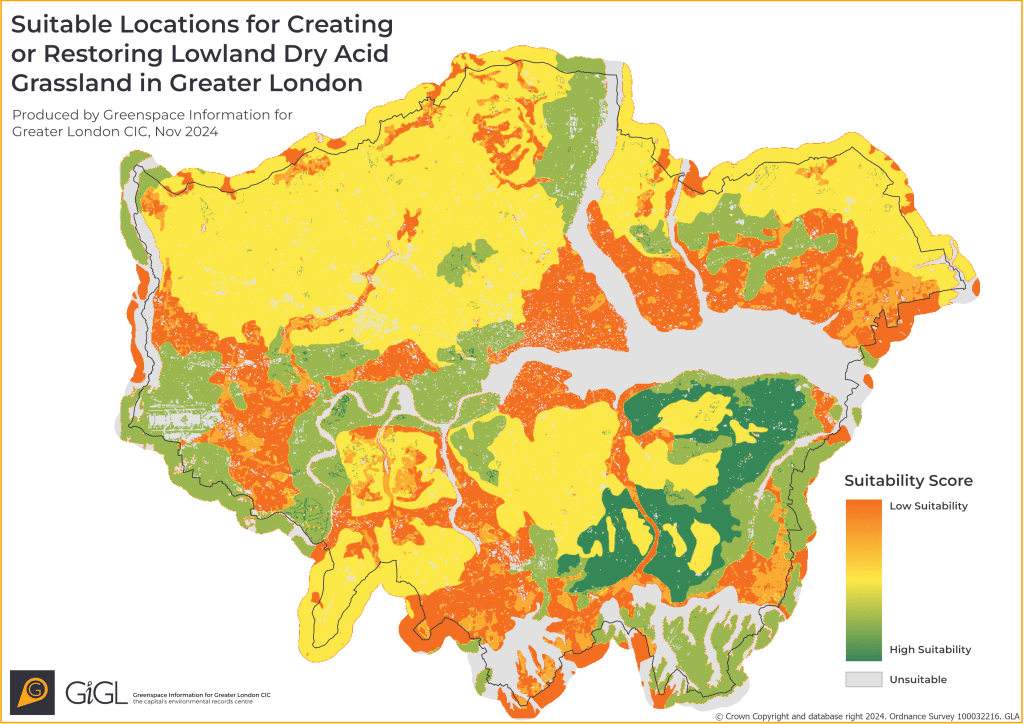
At GiGL, we integrate soil and geology data into our habitat suitability modelling, ensuring that evidence for habitat creation or restoration are grounded in an understanding of London’s foundation. By accounting for these underlying conditions, we can more accurately identify areas where habitats or associated species are most likely to succeed. This approach enables our stakeholders to make more effective conservation plans and ensures that projects like meadow creation or woodland expansion are targeted.
Collaboration is key
London holds a wealth of environmental data, and as we’ve shown, while a single dataset can provide valuable insights, it’s the combination of multiple datasets that unlocks a deeper understanding. None of this work would be possible without collaboration. From GiGL’s dedicated volunteer species recorders and our data-sharing partners to the specialists in other organisations who work tirelessly to digitise and map elements of the world – every contributor plays a vital role! It’s essential to recognise and value the efforts of data collectors, creators and stewards, whose work makes it possible to reveal powerful insights and drive meaningful action.
