In June 2021, GiGL’s Database Officer Amy introduced us to the updates GiGL have been making to our Areas of Deficiency (AoD) models, starting with Areas of Deficiency in Access to Nature (SINCAoD). Now it is the turn of GiGL’s Areas of Deficiency in Access to Public Open Space (POSAoD) maps, which will be released to our SLA partners in April as part of GiGL’s Data Exchange.
Highlights
GiGL will release a new version of the POSAoD maps, generated using an updated model in the April 2022 data exchange
The methodology used to calculate AoD has not changed so the new maps will be broadly comparable to previous GiGL POSAoD maps
The new model enables bespoke modelling.Provided GiGL has the sites, access points and walking distance we can model AoD in Greater London using any criteria available
The new model supports predictive modelling to enable analysis of the effect on AoD of proposed changes to greenspace
What are POSAoD?
POSAoD maps are one of GiGL’s core services to our partners. They provide a meaningful measure of access to open space in London by mapping areas outside a specified walking distance to designated Public Open Spaces (POS). Unlike with SINCAoD, which measure access to Sites of Importance for Nature Conservation (SINCs) in one map, POSAoD is measured at four different levels, based on walking distances to POS of different sizes according to recommendations in the London Plan.
Open Space Categorisation
Description
Size guideline
AoD
Regional Parks
These are large areas, corridors or networks of open space, the majority of which will be publicly-accessible and provide a range of facilities and features offering recreational, ecological, landscape, cultural or green infrastructure benefits. They offer a combination of facilities and features that are unique within London, are readily accessible by public transport and are managed to meet best practice quality standards.
400 ha
Areas outside the recommended 8km walking distance
Metropolitan Parks
These are large areas of open space that provide a similar range of benefits to Regional Parks and offer a combination of facilities at a sub-regional level. They are readily accessible by public transport and are managed to meet best practice quality standards.
60 ha
Areas outside the recommended 3.2km walking distance
District Parks
These are large areas of open space that provide a landscape setting with a variety of natural features. They provide a wide range of activities, including outdoor sports facilities and playing fields, children’s play for different age groups and informal recreation pursuits.
20 ha
Areas outside the recommended 1.2km walking distance
Local Parks and Open Spaces
These provide for court games, children’s play, sitting out areas and nature conservation areas.
2 ha
Areas outside the recommended 400m walking distance
Small Open Spaces
These include public gardens, sitting out areas, children’s play spaces or other areas of a specialist nature, including nature conservation areas.
under 2 ha
Areas outside the recommended 400m walking distance
Pocket Parks
These are small areas of open space that provide natural surfaces and shaded areas for informal play and passive recreation that sometimes have seating and play equipment.
under 0.4 ha
Areas outside the recommended 400m walking distance
Public open space categorisation. Source: https://www.london.gov.uk/what-we-do/planning/london-plan
A final category, Linear Open spaces, is currently not included in AoD mapping, but GiGL will be reviewing this during the 2022-23 financial year.
GiGL’s POSAoD maps are used…
Epping Forest, a large Metropolitan Park in northeast London (Mandy Rudd)…to guide planning
POSAoD maps are key to helping GiGL’s partners, developers, and consultants understand how planning will impact local greenspace;
…to inform policy making
The GLA is using GiGL’s POSAoD maps to provide an evidence base for targeting greening in areas that have deficiencies in access to public open space and a lack of private gardens; and as a factor in climate vulnerability mapping;
…to target funding
GiGL works in partnership with boroughs, using AoD mapping to highlight areas where funding for ward level greening can have the most impact;
…to support communities
GiGL’s POSAoD data helps the London Wildlife Trust’s Keeping It Wild project to choose youth groups to build green spaces with;
…to enable research
Research projects using POSAoD maps have ranged from understanding more about the relationship between access to greenspace and mental well-being, to using census data to understand the size and demographics of communities living within POSAoD.
A reminder of how AoD is measured
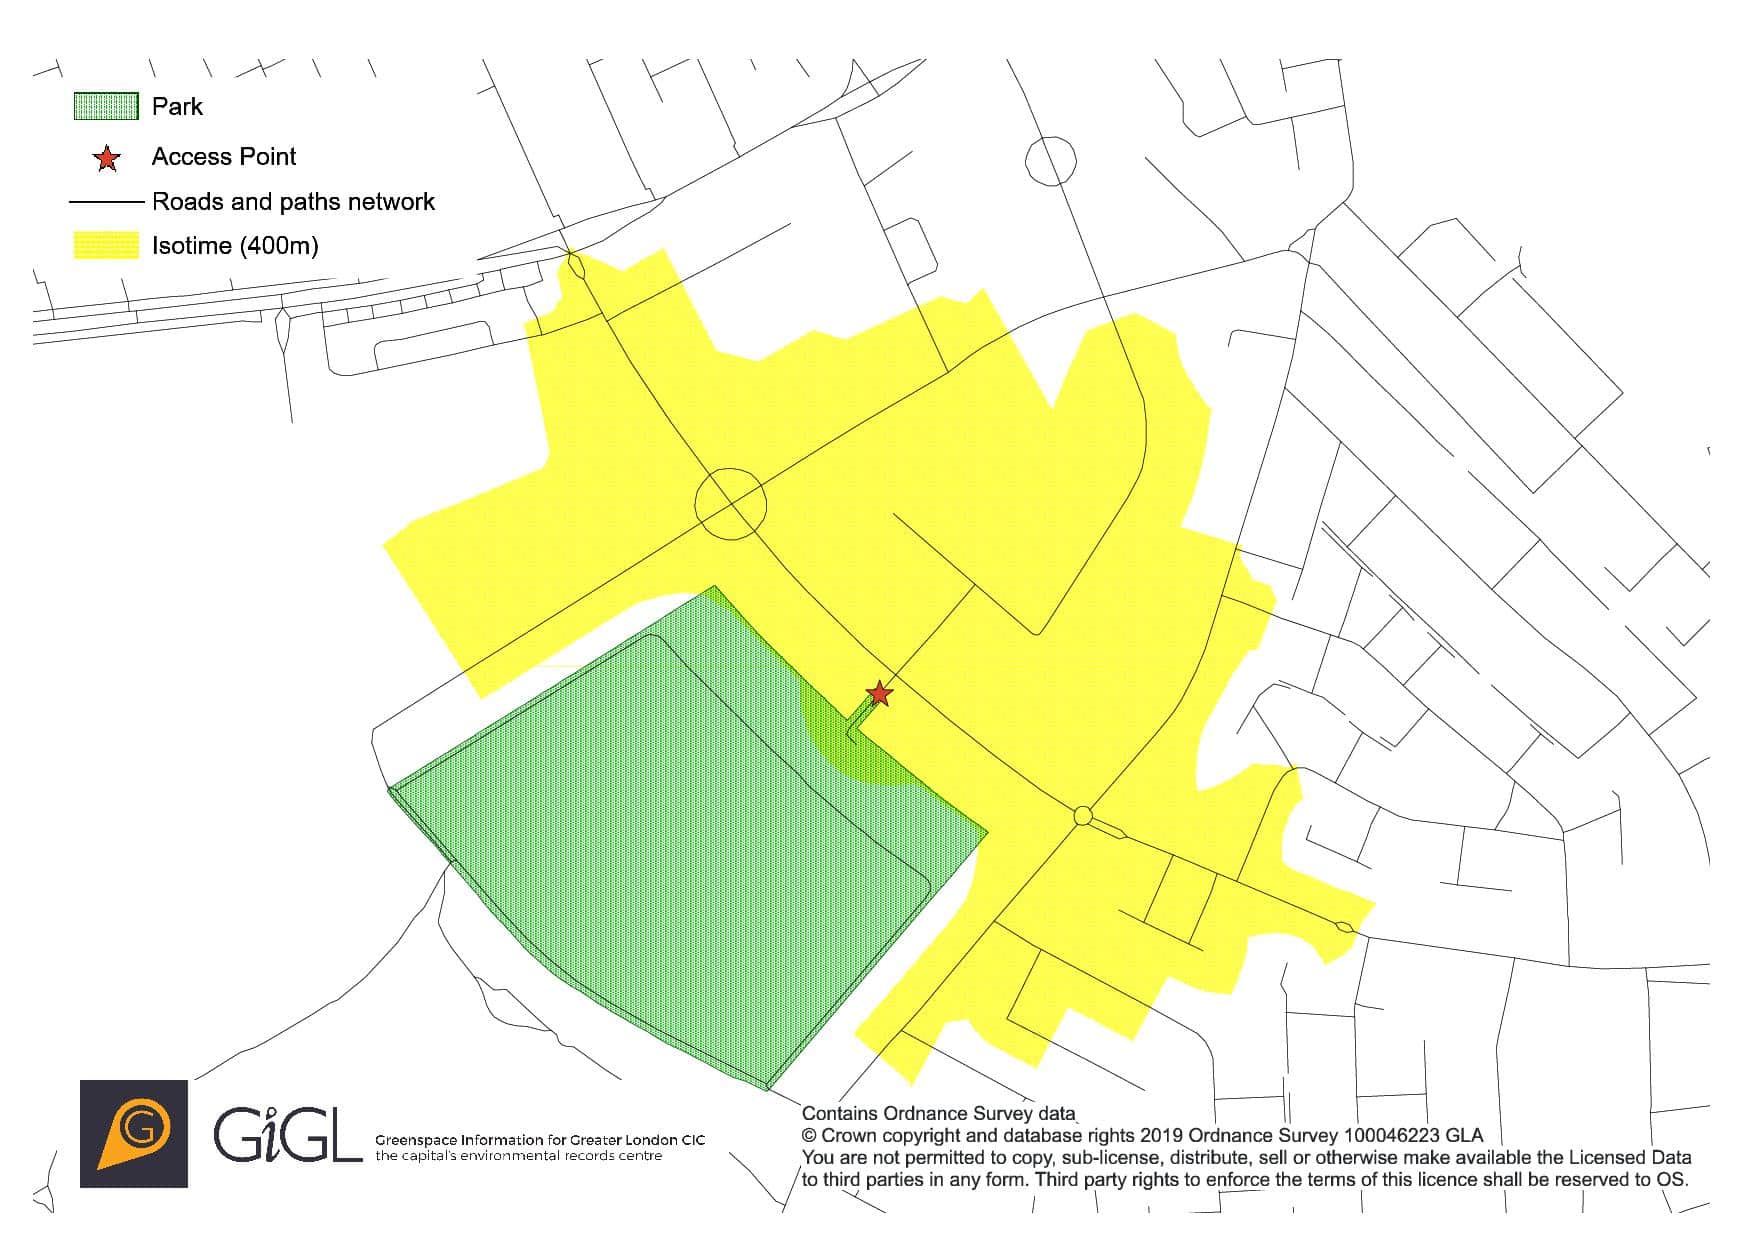
The way GiGL measures AoD hasn’t changed. We still use network analysis to identify all areas that are within a specific distance from a site’s access points along walkable roads and paths.
Areas that are within the specified walking distance of a POS are referred to as isotimes and it is the areas outside these isotimes that are Areas of Deficiency.
A more in-depth look at the methodology can be found in a previous GiGL article.
As part of GiGL’s on-going commitment to improving our data resources we have made extensive updates to the model we use to calculate AoD. The model preserves GiGL’s established AoD methodology, but a more streamlined method enables much faster and more efficient processing.
Access points are key to accurate AoD mapping…
Having mapped site access points is key to the accuracy of GiGL’s AoD models, and we encourage boroughs to send us any access points that are mapped as part of open space surveys or identified through local knowledge. However, in the absence of surveyed access points, GiGL’s AoD model automatically maps access points using Highways Network Data provided by Ordnance Survey. Sites which do not have identified access points are reviewed and the access points mapped manually by GiGL using a variety of online sources. This requirement is the reason that the POSAoD maps are being released so much later than the SINCAoD maps. Following the first run of the new model, GiGL identified 863 POS that had to be individually reviewed and access points identified, a task that, as you can imagine, took some time.
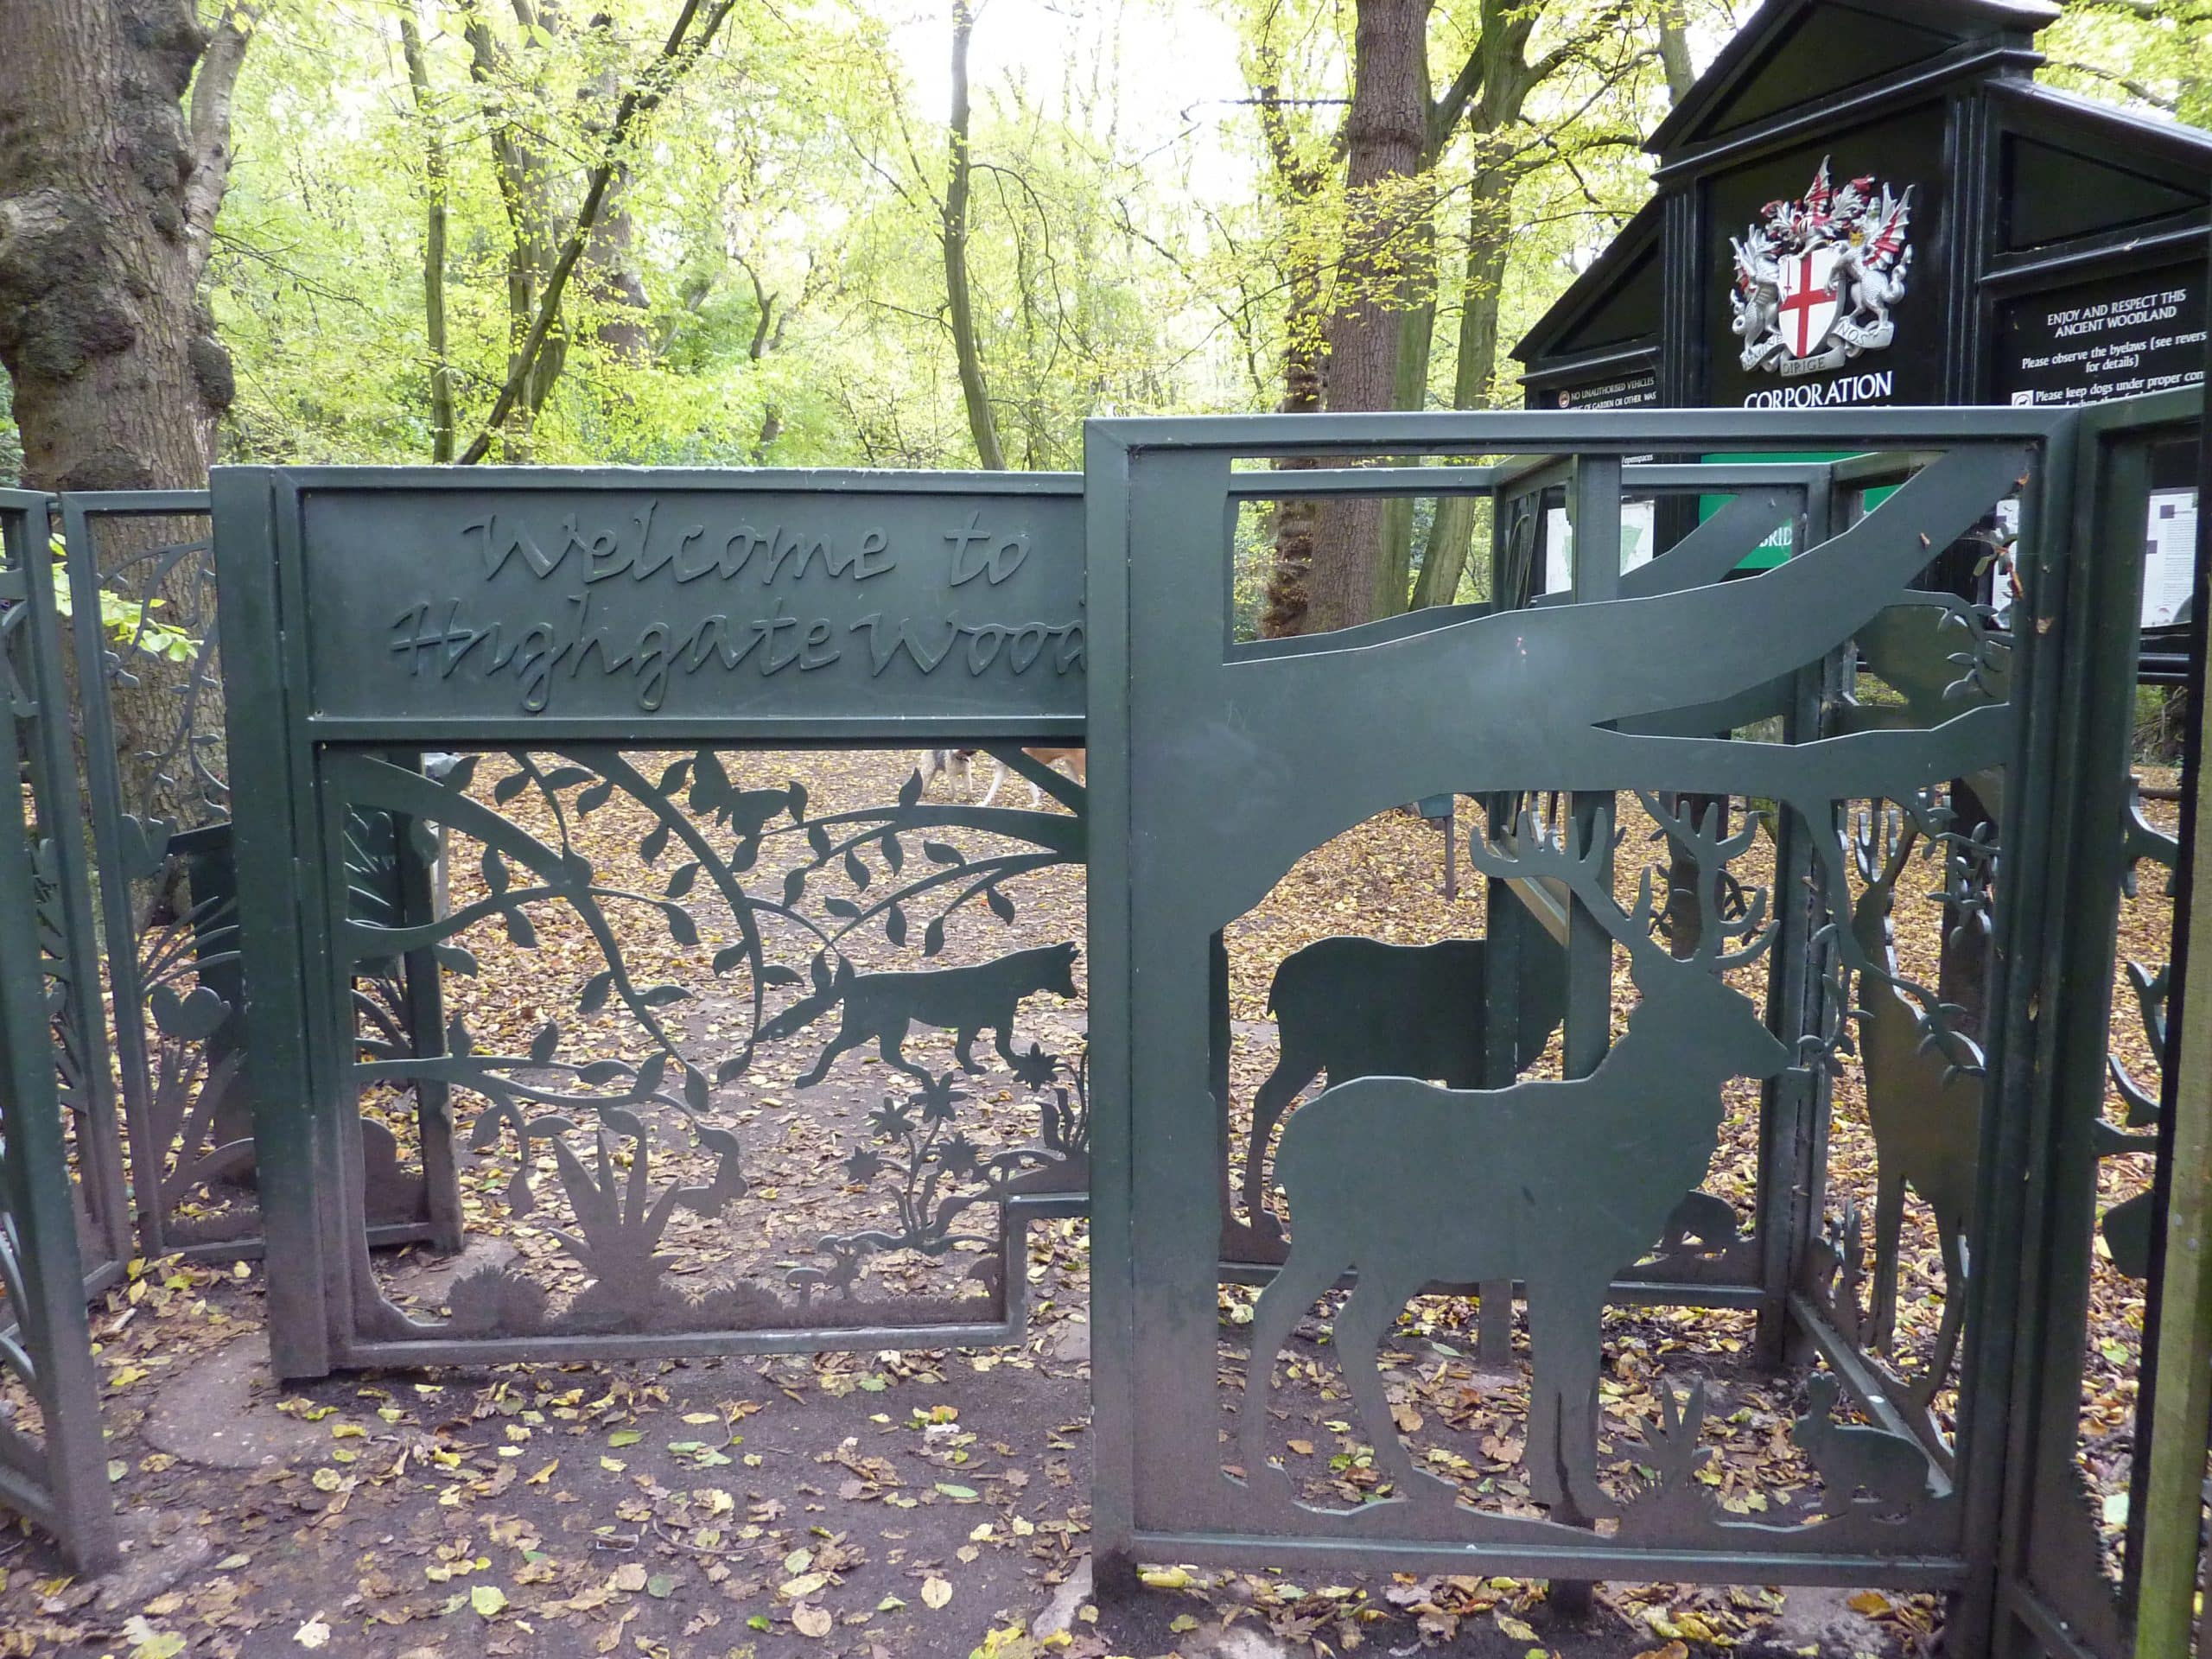
AoD are areas that are outside a specific distance from a site’s access points, like the entrance to Highgate Wood, a District POS site in Haringey (Shirokazan, CC BY 2.0)
New services GiGL can offer using the updated model:
As well as enabling us to process POSAoD maps much more quickly, the model is now fully customisable. This flexibility enables GiGL to provide our partners and clients with custom and predictive modelling. For example, we can now model how changes to site boundaries or their access will impact AoD. This will enable us to help our partners understand the potential impact of new developments on access to public open space. It will also help them to explore different options for reducing AoD, for example, by examining the potential impact of
creating more sites;
expanding the publicly accessible area of existing sites;
improving the quality of open spaces so that they can be designated as Public Open Space or SINCs;
improving access to existing sites by adding entrance points, removing access restrictions or improving local walking routes.
GiGL can also model AoD for specific sites and distances, such as how many people live within 1 km of an accessible play area. Provided we have the sites, access points and distance parameters, we can produce bespoke AoD models for anywhere within Greater London.
What changes will I see in the new POSAoD map?
The updated model will lead to minor changes in the GiGL’s POSAoD maps when compared with the old versions. The majority of these changes are due to updates to the road network and/or boundary data and access points, or a change in the modelling process. Specifically the ‘halo’ of AoD increase that will be seen around many of the AoD boundaries is due a refinement in the way access points are placed on site boundaries, leading to a more accurate travel distances. This has caused a slight reduction in the size of the isotimes, which in turn has led to small increases in AoD. As with the SINCAoD update, GiGL will provide our SLA partners with an outline of the changes and their causes alongside the new release of the POSAoD maps.
Despite these minor changes, GiGL has made an effort to make the new model as comparable with the last release of POSAoD maps as possible to enable our partners to identify differences due to the model before we embark on a more comprehensive review of POS and access points.
POS review
During the process of updating the POSAoD model and reviewing access points, it became clear that we have not received updated POS data from many of our partners for some time. When combined with the questions we have been receiving about how to define POS, this has led GiGL to plan a major review of the POS sites and their access points in GiGL’s Open Space database. The first phase of this review will be working with the GLA and other key stakeholders to understand the aim of the POS designation and how it is defined. This project will start in the next financial year following the release of the new POSAoD maps. If anyone is interested in contributing to this review or has any questions please get in touch. We will provide more detailed information on this project in a future GiGLer article.
Access to POS sites, like Myatts Fields Park in Lambeth, shown here, brings many benefits to local communities (Marathon, CC BY-SA 2.0)
What if I have questions?
If you have any questions or comments about GiGL’s POSAoD maps, the new model, GiGL’s Open Space dataset or the POS review please contact Tanvi.
For any questions on SINCAoD modelling and mapping, please contact Amy.